This digital library houses the book on Oncology and Orthopedic Oncosurgery.

It includes academic lectures, presentations from national and international congresses, published papers, case discussions, performed surgical procedures, and proprietary techniques developed.

The digital format was chosen because the web allows the inclusion of texts with numerous visual resources, such as images and videos, which would not be possible in a printed book.

The content is intended for students, healthcare professionals, and the general public interested in the field.

Technique for Resection of Bone Metastasis of Renal Tumor in the Femur

D63036cfba56a5c3cb75ab14b33fe677 3
Technique for Resection of Bone Metastasis of Renal Tumor in the Femur. A 57-year-old male patient reported the appearance of low back pain at the end of October 2014, radiating to the MIE. Due to the progression of symptoms, he underwent a spinal MRI which reported the presence of a herniated L5-S1 disc. He started physiotherapy and with the worsening of symptoms he underwent a tomography on 02/18/2015, with reports of facet arthrosis L2-L3, L3-L4 and L5-S1 discopathy with protrusion into the medullary canal and x-rays of the pelvis, figures 1 and 2 .

Radiotherapy – Technique for resection of bone metastasis from a kidney tumor in the femur – Reconstruction with polyethylene endoprosthesis

Figura 1: Radiografia da bacia evidenciando lesão de rarefação óssea no colo femoral esquerdo e região trocanteriana. A seta b, em negro, salienta a erosão da cortical medial.
Figure 1: X-ray of the pelvis showing a bone rarefaction lesion in the left femoral neck and trochanteric region. Arrow b, in black, highlights the erosion of the medial cortex.
Figura 2: Radiografia em perfil mostrando a lesão de rarefação na região do trocanter menor.
Figure 2: Lateral radiograph showing the rarefaction lesion in the lesser trochanter region.
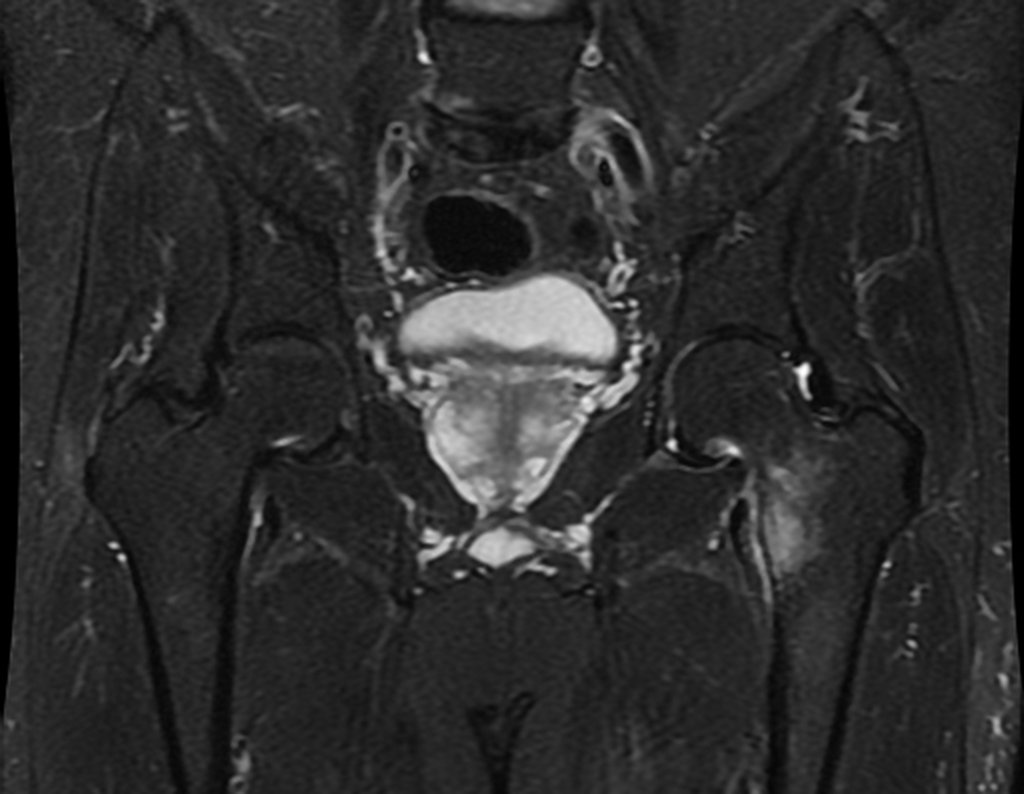
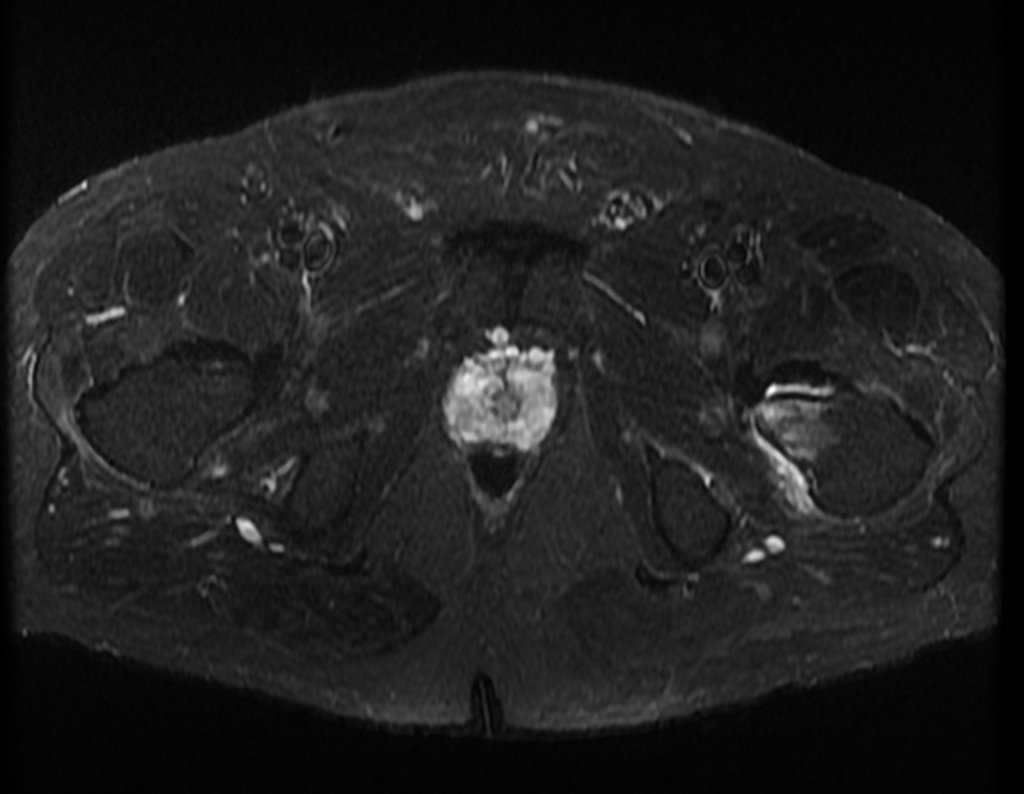
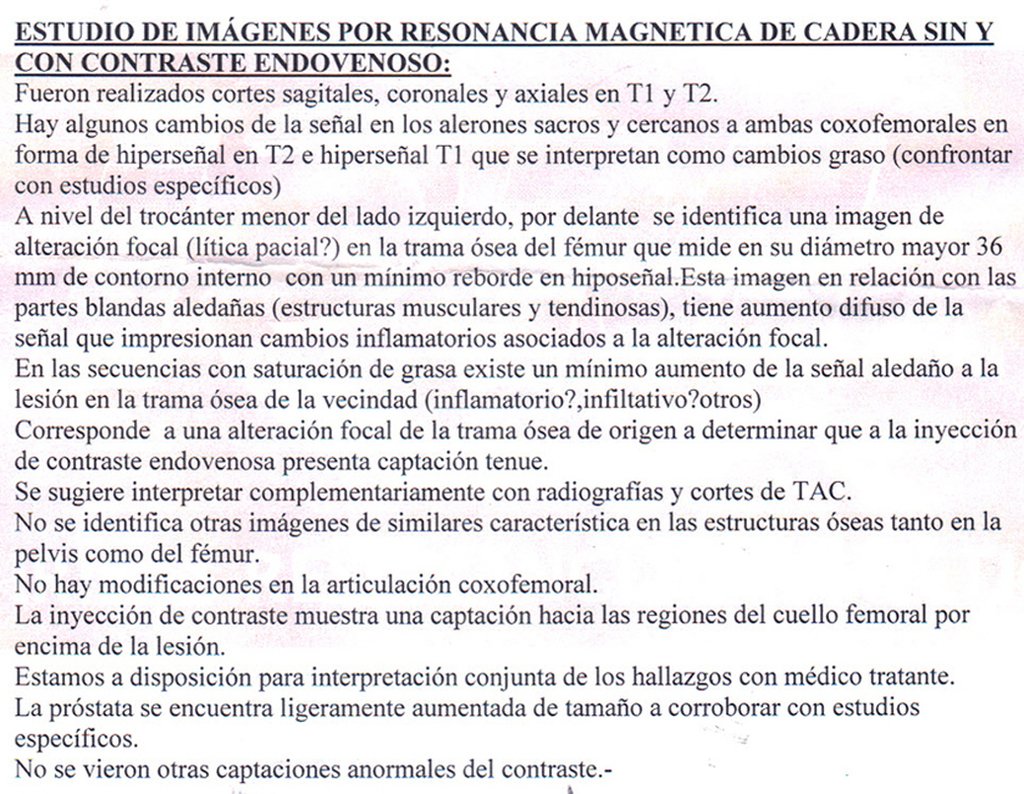
The following day, on 02/19/2015, he had an MRI, this time of the hip, where an osteolytic lesion appears in the left femoral neck and region of the lesser trochanter, measuring 3.6 cm in diameter, with a soft tissue component infiltrating tendons and muscles, figures 3 to 9.
Figura 3: RM coronal T2, de 19/02/2015, com lesão de baixo sinal na face medial do colo femoral e região trocantérica.
Figure 3: Coronal T2 MRI, from 02/19/2015, with a low-signal lesion on the medial surface of the femoral neck and trochanteric region.
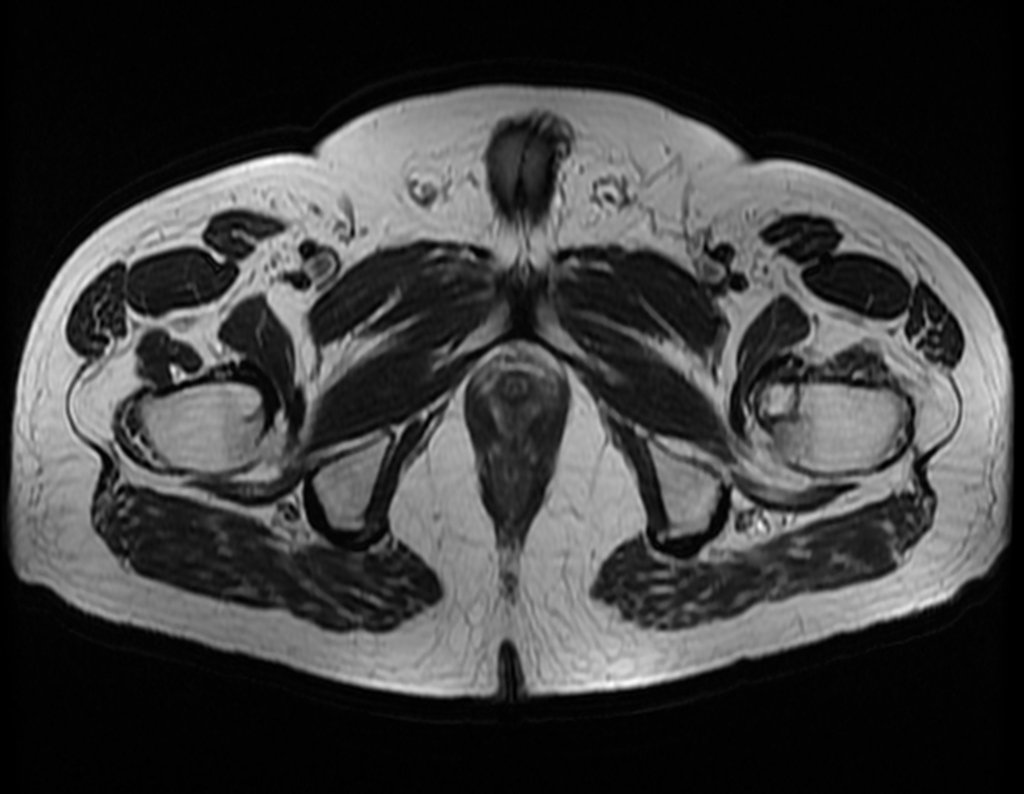
Figura 4: RM axial T2, lesão de baixo sinal no pequeno trocânter e edema medular.
Figure 4: Axial T2 MRI, low signal lesion in the lesser trochanter and spinal cord edema.
Figura 5: RM coronal stir, lesão de sinal intermediário na face medial do fêmur esquerdo.
Figure 5: Coronal stir MRI, intermediate signal lesion on the medial surface of the left femur.
Figura 6: RM axial stir, lesão no pequeno trocânter.
Figure 6: Axial stir MRI, injury to the lesser trochanter.
Figura 7: RM coronal, com saturação de gordura, evidenciando a lesão medial do fêmur esquerdo.
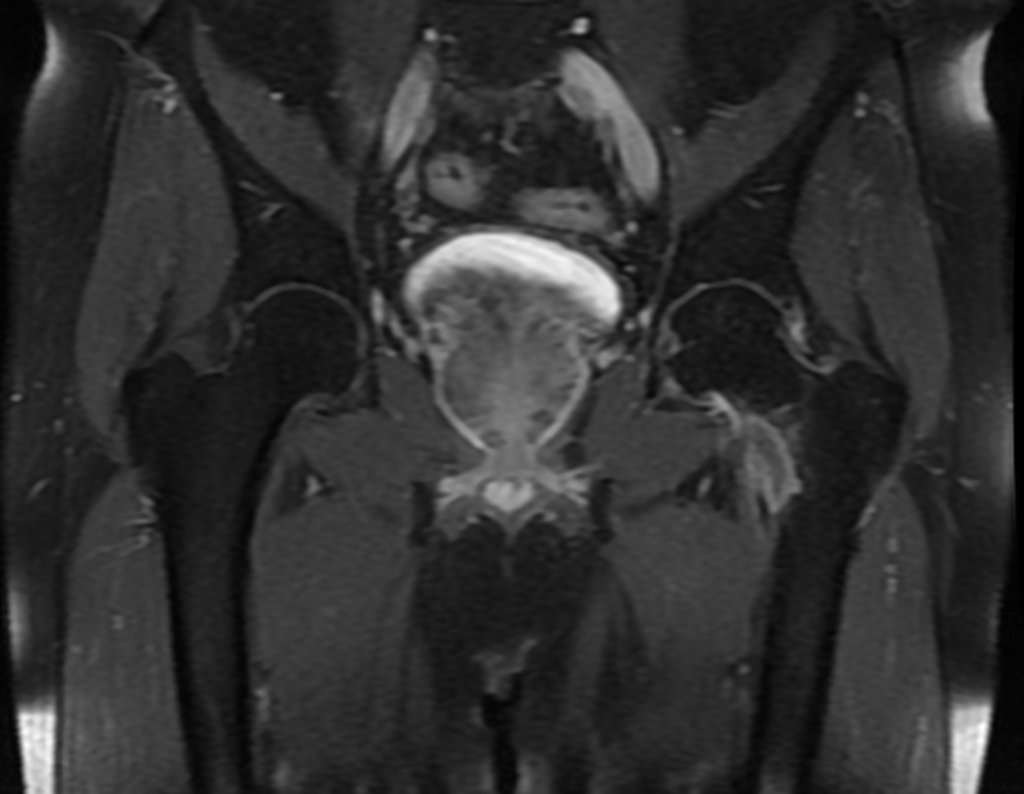
Figure 7: Coronal MRI, with fat saturation, showing the medial lesion of the left femur.
Figura 8: Corte axial com a lesão e edema no pequeno trocânter.
Figure 8: Axial section with the lesion and edema in the lesser trochanter.
Figura 9: Laudo da RM de 19/02/2015.
Figure 9: RM report of 02/19/2015.
The x-ray was repeated and a tomography was performed on 02/20/2015, figures 10 to 13.
Figura 10: Radiografia da bacia frente, em 20/02/2015, mostrando lesão lítica no colo femoral medial esquerdo, seta b, compare o colo femoral normal do lado direito, seta a.
Figure 10: Radiograph of the front pelvis, on 02/20/2015, showing a lytic lesion in the left medial femoral neck, arrow b, compare the normal femoral neck on the right side, arrow a.
Figura 11: Tomografia demonstrando a lesão lítica no pequeno trocânter, seta b.
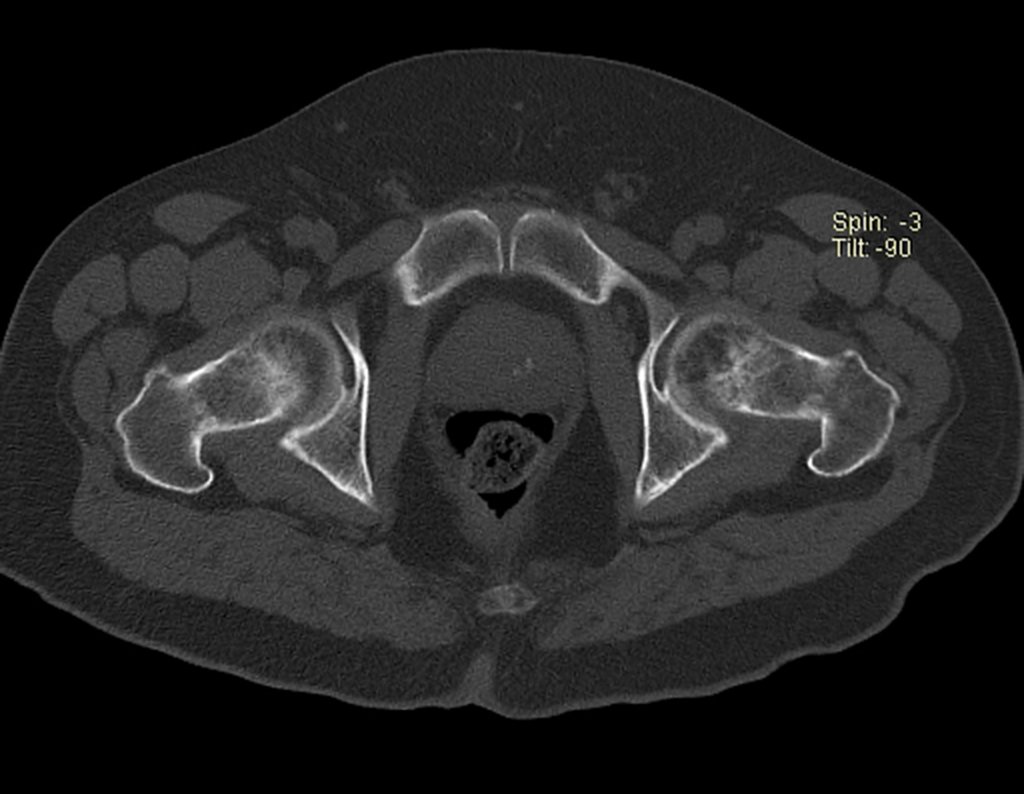
Figure 11: Tomography demonstrating the lytic lesion in the lesser trochanter, arrow b.
Figura 12: Tomografia em corte coronal, lesão lítica e erosão da cortical medial à esquerda, seta b.
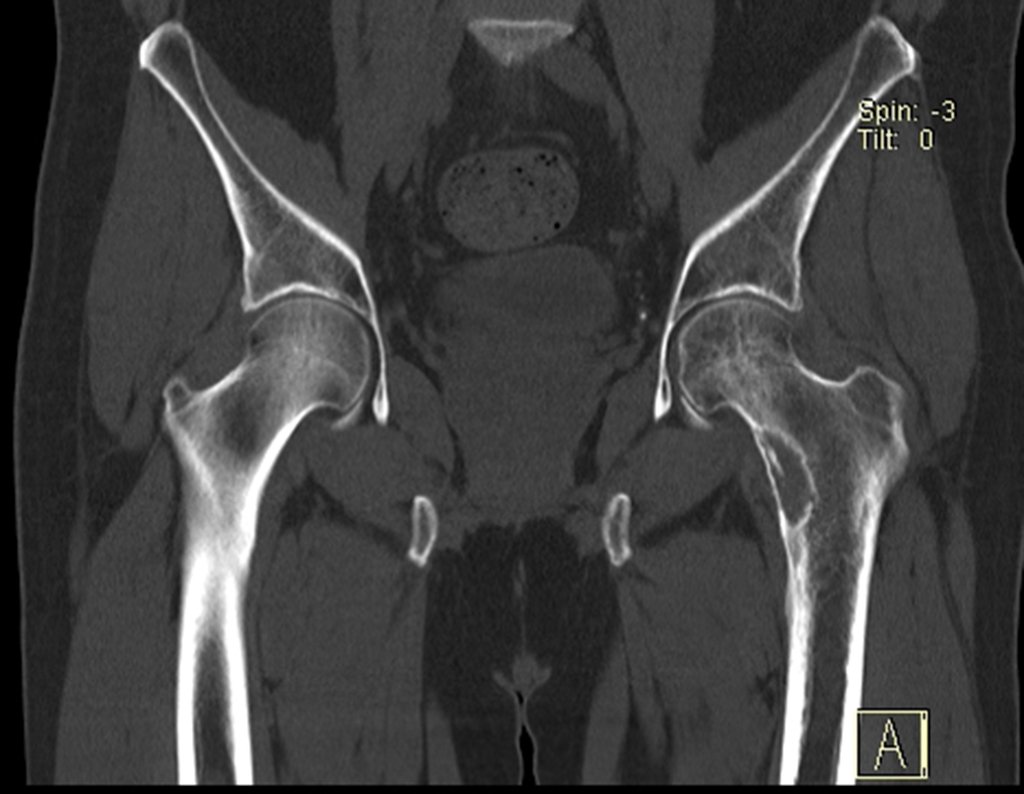
Figure 12: Coronal tomography, lytic lesion and erosion of the medial cortex on the left, arrow b.
Figura 13: Tomografia axial, densidade para osso, lesão lítica no pequeno trocânter.
Figure 13: Axial tomography, bone density, lytic lesion in the lesser trochanter.
The patient seeks care in a hospital specializing in oncology.
Figura 14: O paciente é encaminhado para investigação diagnóstica.
Figure 14: The patient is referred for diagnostic investigation.
Figura 15: Atendido em Hospital especializado, prossegue na investigação diagnóstica.
Figure 15: Attended in a specialized hospital, diagnostic investigation continues.
On 02/23/2015, after clinical evaluation and the images available, we requested a Pet-Ct examination, to complete the imaging studies and staging of the lesion. This examination showed hypermetabolic lesions: lung on the left, SUV=13.2 (probable primary process) and lesion in the left femoral neck, SUV=10.7 (probable secondary process), figures 16 to 21.
Figura 16: Pet-Ct, para o estadiamento da doença, mostra lesão lítica no trocanter menor esquerdo, SUV = 10,7.
Figure 16: Pet-Ct, for disease staging, shows a lytic lesion in the left lesser trochanter, SUV = 10.7.
Figura 17: Pet-Ct, corte axial, lesão no pequeno trocânter.
Figure 17: Pet-Ct, axial section, injury to the lesser trochanter.
Figura 18: Pet-Ct, lesão pulmonar no lobo superior esquerdo de 3,0 cm, SUV=13,2.
Figure 18: Pet-Ct, lung lesion in the left upper lobe of 3.0 cm, SUV=13.2.
Figura 19: Lesão no lobo superior esquerdo, perfil.
Figure 19: Lesion in the left upper lobe, profile.
Figura 20: Corte axial de Pet-Ct com lesão no pulmão esquerdo, SUV=13,2.
Figure 20: Axial section of Pet-Ct with lesion in the left lung, SUV=13.2.
Figura 21: Relatório do Pet-Ct de 23/02/2015.
Figure 21: Pet-Ct report of 02/23/2015.
A biopsy of the lung and femur was performed, the pathological analysis of which diagnosed invasive adenocarcinoma, with an acinar pattern, infiltrating lung tissue and metastatic adenocarcinoma in bone tissue. Presence of mutation in exon 21 c2573T>G(L858R) of the EGFR gene. Absence of rearrangement in the ALK gene. On 03/05/2015, Foundation One: EGFR mutation: ERBB3 amplification: CDK4 amplification: TP53L257P, MYSTT3. No mutation in RET: ALKBRAF; Kras; ERBB2; MET, reports figures 22 to 24.
Figura 22: Laudo da biópsia de pulmão, primeira parte.
Figure 22: Lung biopsy report, first part.
Figura 23: Laudo da biópsia de pulmão, segunda parte.
Figure 23: Lung biopsy report, second part.
Figura 24: Exame imuno-histoquímico, relatório.
Figure 24: Immunohistochemical examination, report.
Figura 25: Relatório da avaliação clínica em 05/03/2015.
Figure 25: Clinical evaluation report on 03/05/2015.
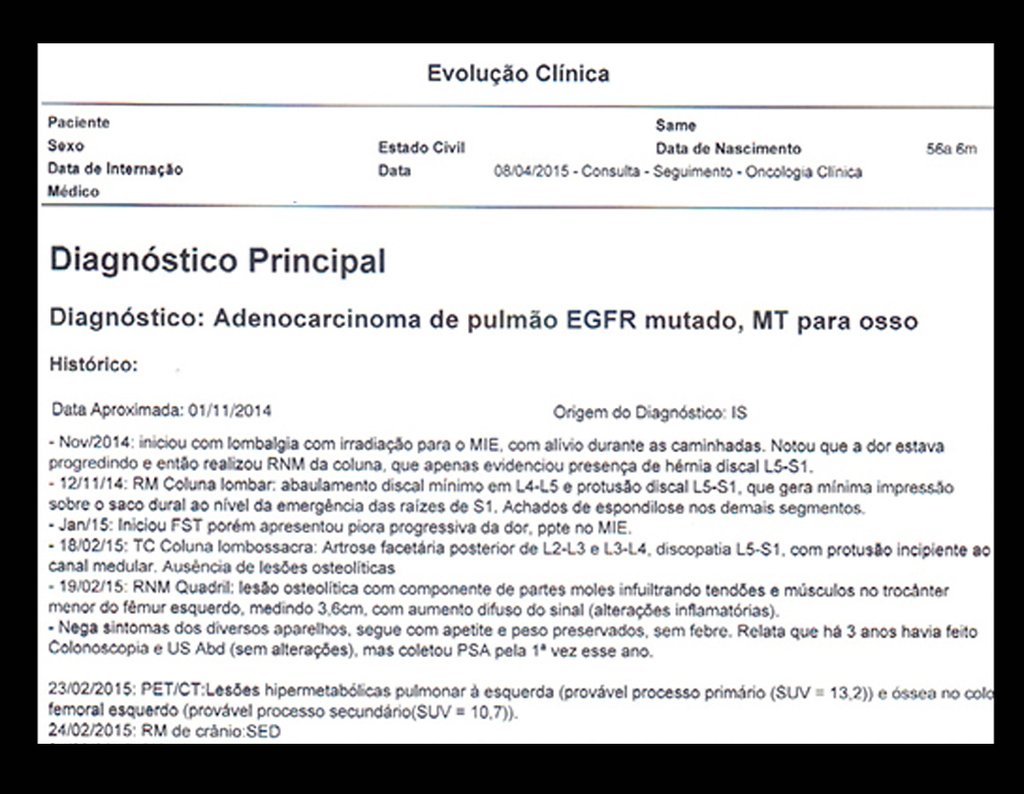
After the evaluation, treatment with extracranial stereotactic radiotherapy was instituted to control the femoral neck lesion and chemotherapy with: Pemetrexed (500 mg/m2) + Cisplatin inj (75 mg/m2) every 21 days. C1D1 02/25/2015; C2D1 03/18/2015, report figure 25 and clinical reassessment on 04/08/2015, figures 26a and 26b.
Figura 26a : Evolução Clínica em 08/04/2015, pagina a.
Figure 26a: Clinical Evolution on 04/08/2015, page a.
Figura 26b: Evolução Clínica em 08/04/2015, página a.
Figure 26b: Clinical Evolution on 04/08/2015, page a.
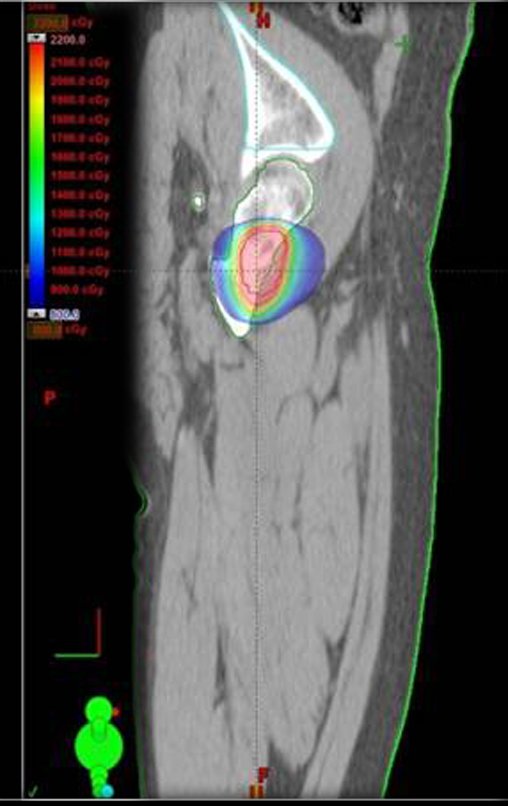
The radiotherapy treatment planning carried out was: 1- Technique: Stereotactic Extra Cranial Radiotherapy (SBRT) 2- Prescription dose: 2000 cGy in a single fraction 3- Energy: 15 MV 4- Technique: 3D 5- Maximum dose in PTV: 2362 cGy 6- Minimum dose: 1808 cGy 7- Median dose: 2195 cGy Figures 26 c to 26 j document the adjuvant treatment instituted.
Figura 26c: Imagem de TC em corte coronal com distribuição de dose no Fêmur esquerdo.
Figure 26c: Coronal CT image with dose distribution in the left femur.
Figura 26d: Reconstrução 3D do planejamento radioterápico.
Figure 26d: 3D reconstruction of radiotherapy planning.
Figura 26e: Imagem de TC em corte sagital, com distribuição de dose no fêmur esquerdo. Isodose de tratamento: Vermelho: 2000 cGy (dose de prescrição); azul 500 cGy (baixa dose).
Figure 26e: CT image in sagittal section, with dose distribution in the left femur. Treatment isodose: Red: 2000 cGy (prescription dose); blue 500 cGy (low dose).
Figura 26f: Imagem de TC em corte axial com distribuição de dose da radiação.
Figure 26f: CT image in axial section with radiation dose distribution.
Figura 26 g: Imagem de TC em corte axial, com distribuição de dose da radiação e apresentação de linha amarela representado o eixo de rotação dos campos de radioterapia. Isodoses de tratamento: Vermelho: 2000 cGy (dose de prescrição); azul 500 cGy (baixa dose).
Figure 26 g: CT image in axial section, with radiation dose distribution and presentation of a yellow line representing the axis of rotation of the radiotherapy fields. Treatment isodoses: Red: 2000 cGy (prescription dose); blue 500 cGy (low dose).
Figura 26h: Histograma de dose-volume: vermelho representado dose no tumor e tons de verde, marrom e amarelo órgãos de riscos, com doses absolutamente menores.
Figure 26h: Dose-volume histogram: red representing dose in the tumor and shades of green, brown and yellow in risk organs, with absolutely lower doses.
Figura 26i: Doses descritas na tabela.
Figure 26i: Doses described in the table.
Figura 27: RM coronal t2, aumento da lesão na cortical do colo medial e na medular.
Figure 27: Coronal MRI t2, increase in the lesion in the cortical bone of the medial neck and in the medulla.
Figura 28: Lesão no pequeno trocânter, com discreto edema e erosão da cortical póstero-medial.
Figure 28: Injury to the lesser trochanter, with slight edema and erosion of the posteromedial cortex.
Figura 29: Captação periférica do contraste, com área de baixo sinal ao centro, provável necrose pela rádioablação?
Figure 29: Peripheral contrast uptake, with an area of ​​low signal in the center, probable necrosis due to radioablation?
Figura 30: RM axial com captação abaixo do pequeno trocânter, tanto na periferia como na medular óssea.
Figure 30: Axial MRI with capture below the lesser trochanter, both in the periphery and in the bone marrow.
Figura 31: RM axial T1 de 06/04/2015, com aumento da lesão no trocânter menor, seta vermelha e área de edema, seta amarela.
Figure 31: Axial T1 MRI on 04/06/2015, with an increase in the lesion in the lesser trochanter, red arrow and area of ​​edema, yellow arrow.
Figura 32: Laudo da RM da pelve, relatando o aumento da lesão.
Figure 32: MRI report of the pelvis, reporting the increase in the lesion.
The chest tomography from April, the radiographs and the hip tomography from May 2015 can be analyzed in figures 33 to 38.
Figura 33: Tomografia de tórax em 25/04/2015.
Figure 33: Chest tomography on 04/25/2015.
Figura 34: Laudo da tomografia de tórax.
Figure 34: Chest tomography report.
Figura 35: Radiografia de bacia frente, lesão lítica no calcar femoral que fragiliza o colo, devido às forças de carga em flexão.
Figure 35: Radiograph of the front pelvis, lytic lesion in the femoral calcar that weakens the neck, due to the load forces in flexion.
Figura 36: Radiografia de bacia em Lowentein com lesão póstero medial no colo femoral.
Figure 36: X-ray of the pelvis in Lowentein with posteromedial lesion in the femoral neck.
Figura 37: Tomografia coronal com lesão lítica e erosão da cortical medial maior que um terço do colo, indicativo de cirurgia, devido a iminência de fratura.
Figure 37: Coronal tomography with lytic lesion and medial cortical erosion greater than a third of the neck, indicative of surgery, due to imminent fracture.
Figura 38: Tomografia sagital com lesão lítica maior do que um terço do diâmetro do osso.
Figure 38: Sagittal tomography with a lytic lesion greater than one third of the bone diameter.

In the orthopedic evaluation at this time, the patient did not present significant symptoms.

We considered the short period of radioablation and chemotherapy treatment, as well as the risk of fracture.

The medullary irrigation of the femoral neck in adults is retrograde, from the metaphysis to the epiphysis. The main irrigation of the epiphysis is through the posterior circumflex artery, which may have been the route of metastatic dissemination and may even be compromised. To make matters more difficult, the femoral neck has a very weak periosteum, with little capacity for bone regeneration, which is the cause of many failures in bone consolidation when fractures occur in this region.

Together with the patient and family, we decided to wait, trying to give more time and opportunity for bone repair. We chose to reevaluate in July, with new imaging tests, paying attention to the symptoms.

Postponing surgery is a difficult decision. The expectation and anxiety is shared and experienced by everyone.

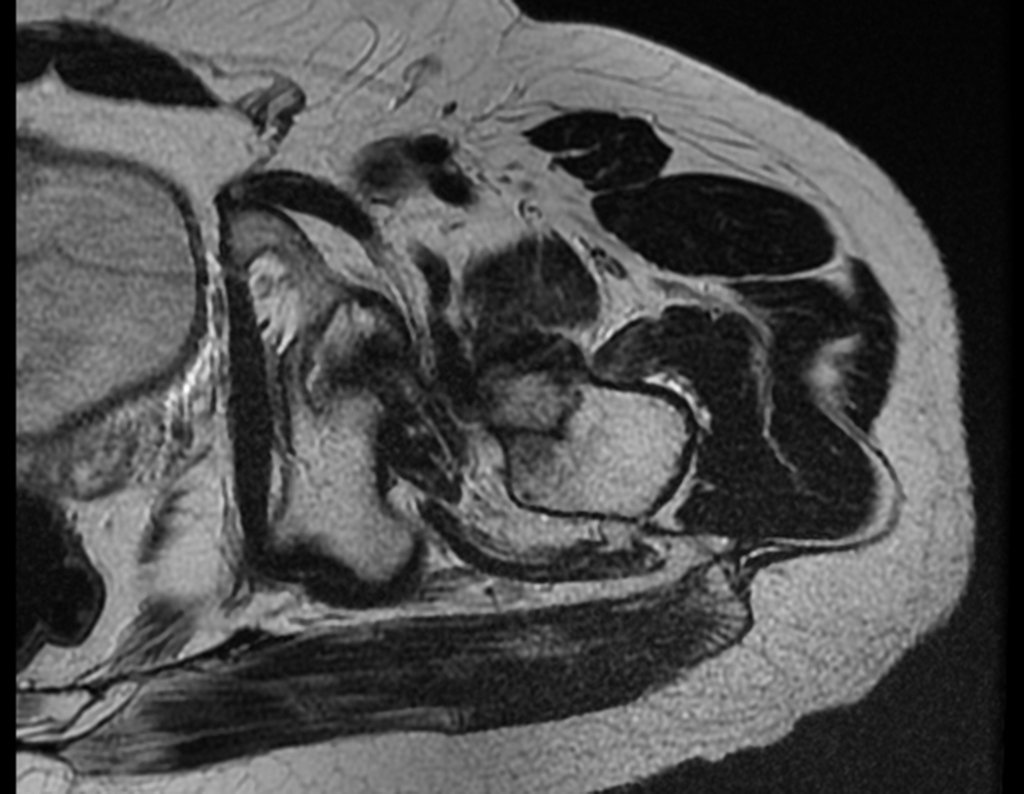
The patient returns on July 22, 2015, complaining of pain when moving from sitting to standing, pain when rotating the hip and limping. The imaging exams, from the MRI on July 18, 2015, are analyzed in figures 39 to 59.

Figura 39: Tomografia axial com lesão lítica no pequeno trocânter e erosão da cortical.
Figure 39: Axial tomography with lytic lesion in the lesser trochanter and cortical erosion.
Figura 40: Tomografia com erosão em roído de traça na cortical da diáfise femoral subtrocantérica.
Figure 40: Tomography showing moth-eaten erosion in the cortex of the subtrochanteric femoral diaphysis.
Figura 41: RM coronal T2 evidenciando traço de fratura incompleta no colo femoral, seta em vermelho, devido a aumento da erosão da cortical medial, entre as setas em amarelo, provavelmente devido à não ossificação após a radioablação.
Figure 41: Coronal T2 MRI showing an incomplete fracture line in the femoral neck, arrow in red, due to increased erosion of the medial cortex, between arrows in yellow, probably due to non-ossification after radioablation.
Figura 42: RM axial com lesão lítica no pequeno trocânter. Nesta região do calcar femoral, devido ao ângulo de carga em flexão do quadril, a falta de apoio propicia o stress no colo, levando à fratura.
Figure 42: Axial MRI with lytic lesion in the lesser trochanter. In this region of the femoral calcar, due to the load angle in hip flexion, the lack of support causes stress on the neck, leading to fracture.
Figura 43: A lesão continua aumentando e aparece sinal de traço de fratura incompleta no colo femoral, seta em vermelho.
Figure 43: The lesion continues to increase and a sign of an incomplete fracture appears on the femoral neck, red arrow.
Figura 44: Tomografia axial, lesão e edema no pequeno trocânter.
Figure 44: Axial tomography, injury and edema in the lesser trochanter.
Figura 45: RM axial T1 com traço de fratura incompleta no colo femoral, seta em vermelho.
Figure 45: Axial T1 MRI with incomplete fracture line in the femoral neck, red arrow.
Figura 46: RM axial T1 com edema no colo femoral e evidente traço de fratura incompleto.
Figure 46: Axial T1 MRI with edema in the femoral neck and evident incomplete fracture line.
Figura 47: RM coronal com saturação de gordura evidenciando o traço de fratura no colo femoral, seta em amarelo.
Figure 47: Coronal MRI with fat saturation showing the fracture line in the femoral neck, yellow arrow.
Figura 48: RM axial com saturação de gordura apresentando traços irregulares no colo.
Figure 48: Axial MRI with fat saturation showing irregular features in the neck.
Figura 49: RM coronal T1 com falha na cortical medial, seta amarela e linhas de força do grande trocânter com traços de fragilidade, stress.
Figure 49: Coronal T1 MRI with failure in the medial cortex, yellow arrow and lines of force of the greater trochanter with traces of fragility and stress.
Figura 50: RM axial, lesão lítica no pequeno trocânter e erosão da cortical, com aumento do edema na medular, seta em vermelho.
Figure 50: Axial MRI, lytic lesion in the lesser trochanter and cortical erosion, with increased edema in the medulla, red arrow.
Figura 51: Outro corte de RM axial T1, evidente traço de fratura incompleta no colo femoral, com aumento do edema na medular, seta em vermelho.
Figure 51: Another T1 axial MRI section, evident trace of incomplete fracture in the femoral neck, with increased edema in the medullary bone, red arrow.
Figura 52: RM axial, lesão lítica acima do pequeno trocânter e edema na medular.
Figure 52: Axial MRI, lytic lesion above the lesser trochanter and spinal cord edema.
Figura 53: RM coronal com traços de fratura no colo, setas em amarelo.
Figure 53: Coronal MRI with traces of fracture in the neck, arrows in yellow.
Figura 54: RM axial com traços de stress no colo.
Figure 54: Axial MRI with traces of stress in the neck.
Figura 55: RM com evidente comprometimento mecânico do colo femoral, por forças de stress em flexão, propiciando a ocorrência de fratura.
Figure 55: MRI with evident mechanical compromise of the femoral neck, due to stress forces in flexion, leading to the occurrence of fracture.
Figura 56: RM axial, fragilidade no colo e cabeça femoral.
Figure 56: Axial MRI, fragility in the femoral neck and head.
Figura 57: RM axial, aumento de captação na metáfise femoral.
Figure 57: Axial MRI, increased uptake in the femoral metaphysis.
Figura 58: RM com comprometimento da metáfise femoral.
Figure 58: MRI with involvement of the femoral metaphysis.
Figura 59: Laudo da RM de Pélvis relatando alterações trabeculares por prováveis traços de fratura.
Figure 59: Pelvis MRI report reporting trabecular changes due to probable fracture lines.
Figura 60: Tomografia de tórax com a cicatriz da lesão pulmonar.
Figure 60: Chest tomography with the lung lesion scar.
Figura 61: Tomografia de tórax sem outras alterações.
Figure 61: Chest tomography without other changes.
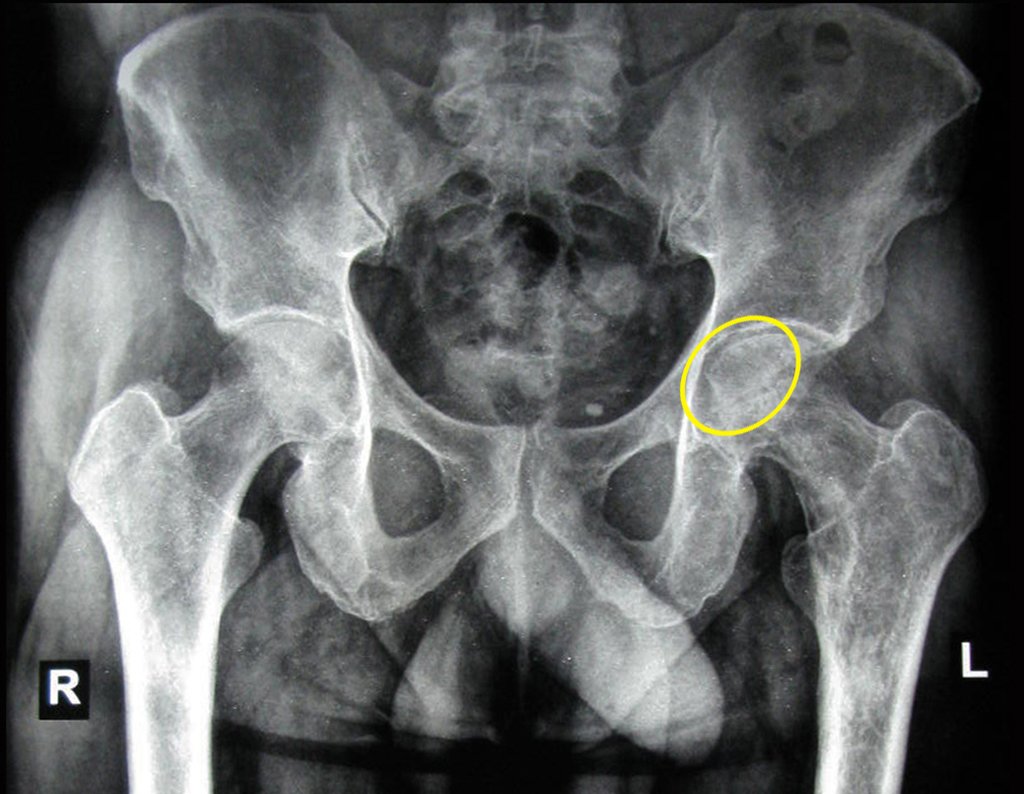
Figura 62: Radiografia de 20/07/2015 com rarefação óssea na cabeça femoral, e na região medial do fêmur.
Figure 62: Radiograph from 07/20/2015 with bone rarefaction in the femoral head and in the medial region of the femur.
Figura 63: Radiografia da bacia em Lowenstein com acentuação da osteoporose no fêmur.
Figure 63: Radiograph of the pelvis in Lowenstein with accentuation of osteoporosis in the femur.
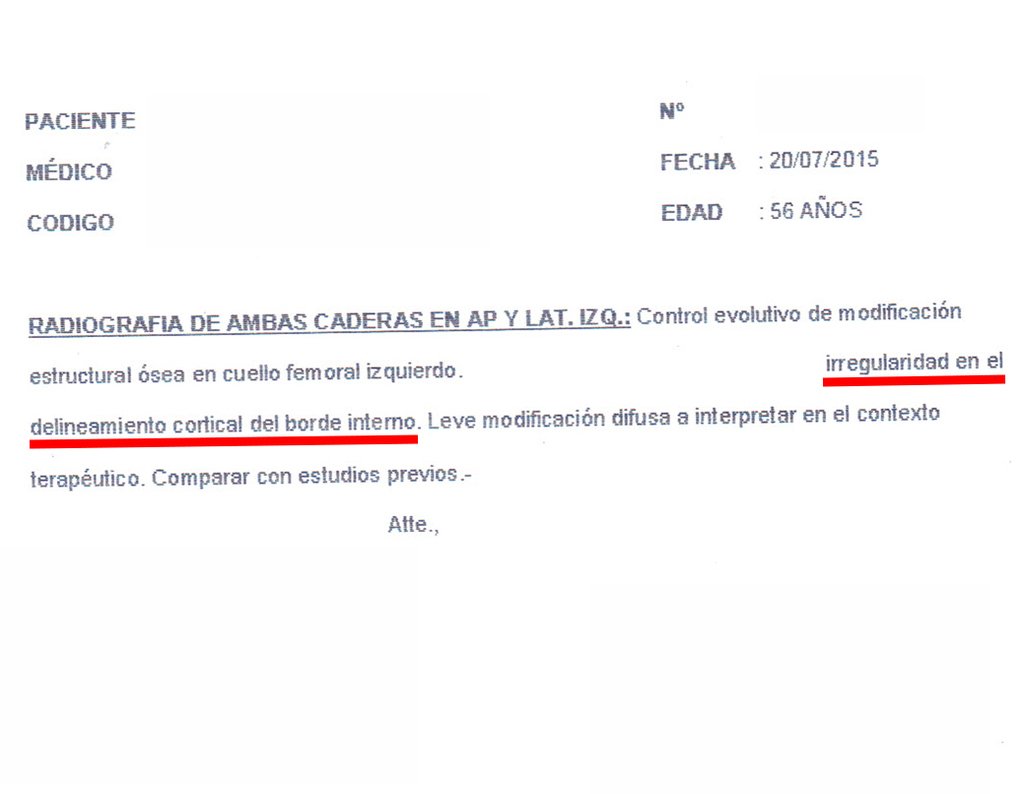
Figura 64: Laudo das radiografias de 20/07/2015.
Figure 64: X-ray report from 07/20/2015.
Figura 65: Tomografia axial com rarefação na cabeça femoral esquerda.
Figure 65: Axial tomography with rarefaction in the left femoral head.
Figura 66: Tomografia com rarefação na cortical do fêmur esquerdo, região subtrocantériana.
Figure 66: Tomography with rarefaction in the cortex of the left femur, subtrochanteric region.
Figura 67: Tomografia coronal com lesão no colo esquerdo e rarefação em todo o 1/3 proximal, comparativamente com o lado direito.
Figure 67: Coronal tomography with lesion in the left neck and rarefaction in the entire proximal 1/3, compared to the right side.
Figura 68: Tomografia com osteoporose no fêmur esquerdo, seta em vermelho, comparativamente com o lado direito, seta em branco.
Figure 68: Tomography showing osteoporosis in the left femur, red arrow, compared to the right side, white arrow.
Figura 69: Tomografia do fêmur em corte sagital, com duas áreas de rarefação, ocupando mais de 50% da largura do colo.
Figure 69: Tomography of the femur in a sagittal section, with two areas of rarefaction, occupying more than 50% of the width of the neck.
Figura 70: Tomografia sagital, as setas em vermelho apontam as duas grandes lesões líticas no colo femoral, fragilizando-o e propiciando a ocorrência de fratura.
Figure 70: Sagittal tomography, the red arrows point to the two large lytic lesions in the femoral neck, weakening it and causing fractures.
Figura 71: Posicionamento do paciente em decúbito lateral direito.
Figure 71: Positioning of the patient in the right lateral decubitus position.
Figure 72: Asepsis and antisepsis, of the left lower limb.
Figure 73: Placement of the fields.
Figure 74: Marking of the lateral and posterior surgical incision on the thigh.
Figura 75: Incisão na pele e subcutâneo superficial. Hemostasia cuidadosa com eltrocautério, por camadas.
Figure 75: Incision in the skin and superficial subcutaneous tissue. Careful hemostasis with electrocautery, in layers.
Figura 76: Aprofunda-se a incisão no subcutâneo por camadas, realizando-se a cauterização passo a passo. A tesoura é posicionada para a abertura da fáscia.
Figure 76: The incision is deepened into the subcutaneous tissue in layers, carrying out cauterization step by step. The scissors are positioned to open the fascia.

The surgery must be performed with caution, deepening the incision  little by little , to achieve  hemostasis in layers . Adequate anesthesia  should not induce hypotension , as this is the only way the surgeon can properly observe the sectioned capillaries and make sure that he is performing an operation without blood loss, neither at that moment nor at a later time.

In oncological surgeries, the surgeon cannot have a “heavy” hand. The patient is already weakened by the illness, by chemotherapy, has possibly already undergone transfusions and the need for blood replacement must be avoided. Garroting should not be used except in amputation surgeries.

During anesthesia the patient cannot feel pain. It is not enough to be sedated, as if there is pain it increases the pressure, making hemostasis with electrocautery difficult.

Figura 77: Abertura e afastamento da fáscia, expondo-se os músculos vasto lateral e glúteo médio.
Figure 77: Opening and pulling away of the fascia, exposing the vastus lateralis and gluteus medius muscles.
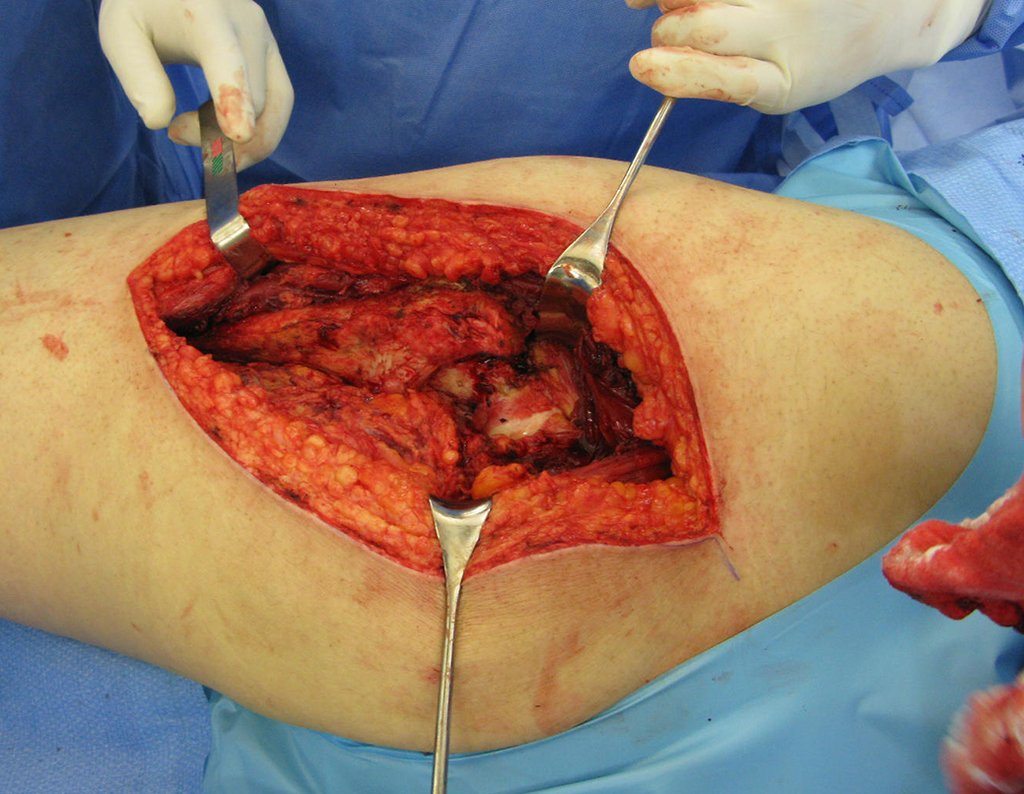
Figura 78: Os músculos vastos lateral e glúteo médio dever ser dissecados e "desinseridos" do grande trocânter como um "tendão conjunto", para podermos fixá-los na prótese e propiciar uma marcha sem claudicação.
Figure 78: The vastus lateralis and gluteus medius muscles must be dissected and "disinserted" from the greater trochanter as a "joint tendon", so that we can fix them to the prosthesis and provide gait without lameness.
In surgeries for bone metastases in the proximal third of the femur, we can remove the joint tendon of the gluteus medius and vastus lateralis muscles, with an electric scalpel, very close to the periosteum. This is a sufficient margin as it is a secondary lesion, except when the primitive tumor is melanoma.
Figura 79: Exposição do terço proximal, colo e cabeça femoral, posteriormente. Utilizamos o eletrocautério como se fosse uma "rugina", para desinserir o tendão conjunto.
Figure 79: Exposure of the proximal third, femoral neck and head, posteriorly. We use electrocautery as if it were a "rugina", to disinsert the joint tendon.
Figura 80: Com uma discreta rotação externa, continua-se a liberação lateral e anteriormente.
Figure 80: With a slight external rotation, the release continues laterally and anteriorly.
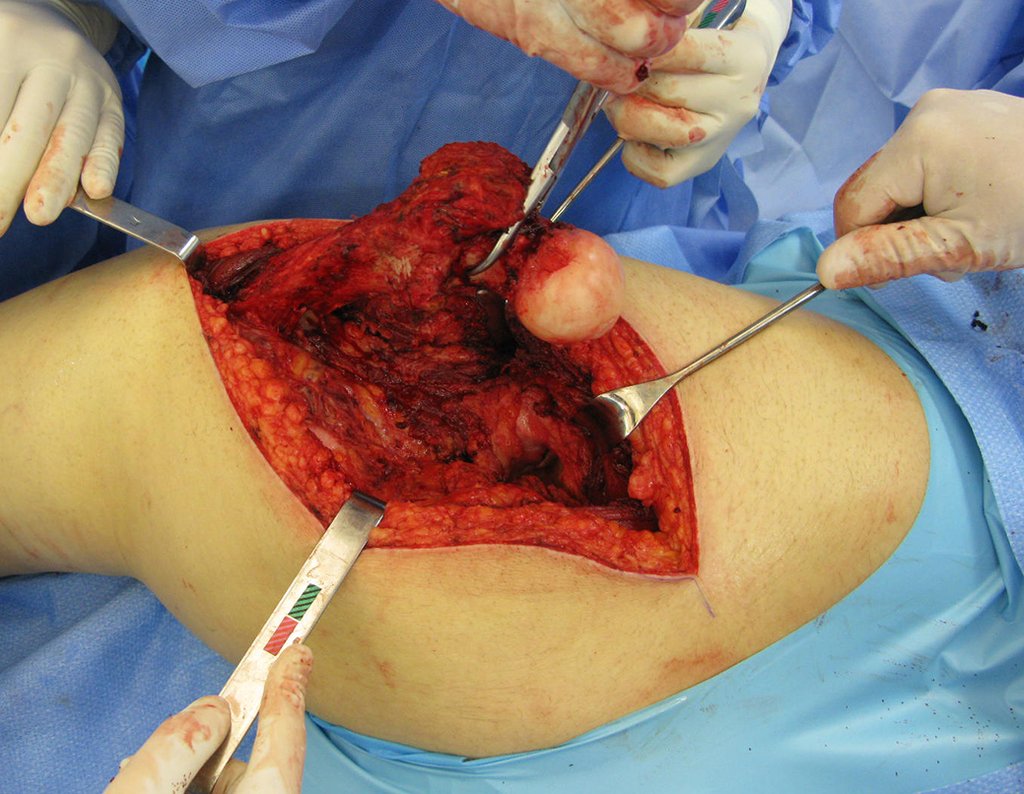
Figura 81: Com auxílio de uma pinça de osso realizamos a luxação do quadril.
Figure 81: With the help of a bone clamp, we dislocated the hip.
Figura 82: Desinserção do ligamento redondo e limpeza da cavidade acetabular.
Figure 82: Disinsertion of the round ligament and cleaning of the acetabular cavity.
Note that surgery with caution allows for adequate hemostasis. Blood loss is controlled, despite major surgery, with extensive exposure. The surgical procedure is like a courtship, the oncology surgeon cannot be rushed.
Figura 83: Mensuração do segmento a ser ressecado.
Figure 83: Measurement of the segment to be resected.
Figura 84: Exposição para a osteotomia. Fixa-se o segmento a ser ressecado com duas pinças de osso. Uma pinça é posicionada na diáfise, abaixo da marca para a osteotomia, e outra no colo femoral.
Figure 84: Exposure for osteotomy. The segment to be resected is fixed with two bone forceps. One clamp is positioned on the diaphysis, below the mark for the osteotomy, and another on the femoral neck.
The osteotomy can be performed with an electric saw or a Gigle saw. It must be perpendicular to the diaphysis, for the correct adaptation of the prosthesis. As there is no cutting guide, it depends on the team’s skill, video 1.
Video 1: Perpendicular cut of the diaphysis, with a giglê saw.
After the osteotomy, a sample is taken from the medullary canal to study the distal margin and the acetabulum is prepared to be exposed, figures 85 and 86.
Figura 85: Coleta de amostra do canal medular, distalmente à osteotomia, para estudo histológico.
Figure 85: Collection of a sample from the spinal canal, distal to the osteotomy, for histological study.
Figura 86: Posicionamento de afastadores de Hofmann para melhor exposição do acetábulo.
Figure 86: Positioning of Hofmann retractors for better exposure of the acetabulum.
Video 2: Reaming of the acetabulum and removal of articular cartilage.
Video 3: Making the cement containment holes to fix the acetabular prosthesis.
Video 4: Acetabulum prepared for cementation. Final irrigation.
Figura 87: Irrigação final, exposição com afastadores de Hofmann, acetábulo preparado.
Figure 87: Final irrigation, exposure with Hofmann retractors, prepared acetabulum.
Figura 88: Colocação de cimento no fundo do acetábulo.
Figure 88: Placement of cement at the bottom of the acetabulum.
Video 5: Cementation of the acetabular component, using the positioner.
Figura 89: Prótese colocada, retirada do posicionador.
Figure 89: Prosthesis placed, removed from the positioner.
Figura 90: Colocação do impactor final, para manter o acetábulo sob pressão, enquanto seca o cimento.
Figure 90: Placement of the final impactor, to keep the acetabulum under pressure while the cement dries.
Video 6: Removing excess cement.
Video 7: Excess cement removed.
Video 8: Reaming of the femoral canal with flexible drills.
Figura 91: Teste da largura do canal com haste de 13 mm. A frezagem deve ter 1 mm a mais, para o preenchimento com cimento.
Figure 91: Channel width test with 13 mm rod. The milling must be 1 mm larger to fill with cement.
Figura 92: Com uma escova remove-se os fragmentos ósseos da frezagem.
Figure 92: Using a brush, remove bone fragments from milling.
Video 9: Brushing the walls and cleaning the femoral canal.
Figura 93: Mensuração do plug de contensão do cimento no canal femoral.
Figure 93: Measurement of the cement containment plug in the femoral canal.
Figura 94: Posicionamento e colocação do plug de contensão do cimento no canal femoral.
Figure 94: Positioning and placing the cement containment plug in the femoral canal.
Figura 95: Mensuração do segmento ressecado e montagem da prótese de prova.
Figure 95: Measurement of the resected segment and assembly of the trial prosthesis.
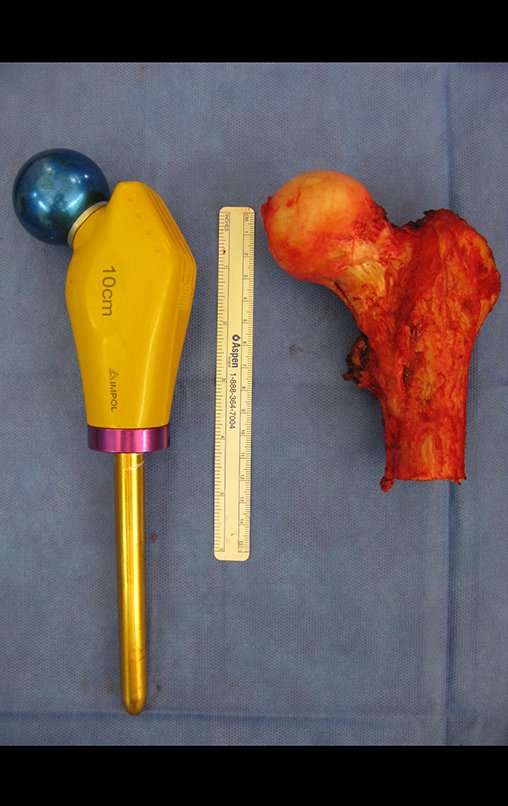
Figura 96: Endoprótese modular de polietileno montada.
Figure 96: Assembled modular polyethylene stent.
Figura 97: Segmento ressecado, face anterior.
Figure 97: Resected segment, anterior surface.
Figura 98: Segmento ressecado, face posterior.
Figure 98: Resected segment, posterior surface.
Video 10: Cementation of the femoral stem in the polyethylene module.
Video 11: Placing cement in the femoral canal with a gun.
Figura 99: Cimentação da prótese no canal femoral, com 10 graus de anteversão, redução e preparo para o fechamento.
Figure 99: Cementation of the prosthesis in the femoral canal, with 10 degrees of anteversion, reduction and preparation for closure.
Figura 100: Fixação do tendão conjunto do músculo médio glúteo e vasto lateral na prótese. Boa fixação e cobertura.
Figure 100: Fixation of the joint tendon of the gluteus medius muscle and vastus lateralis to the prosthesis. Good fixation and coverage.
Figura 101: Colocação de dreno, fechamento da fáscia lata, subcutâneo e pele.
Figure 101: Drain placement, closure of the fascia lata, subcutaneous tissue and skin.
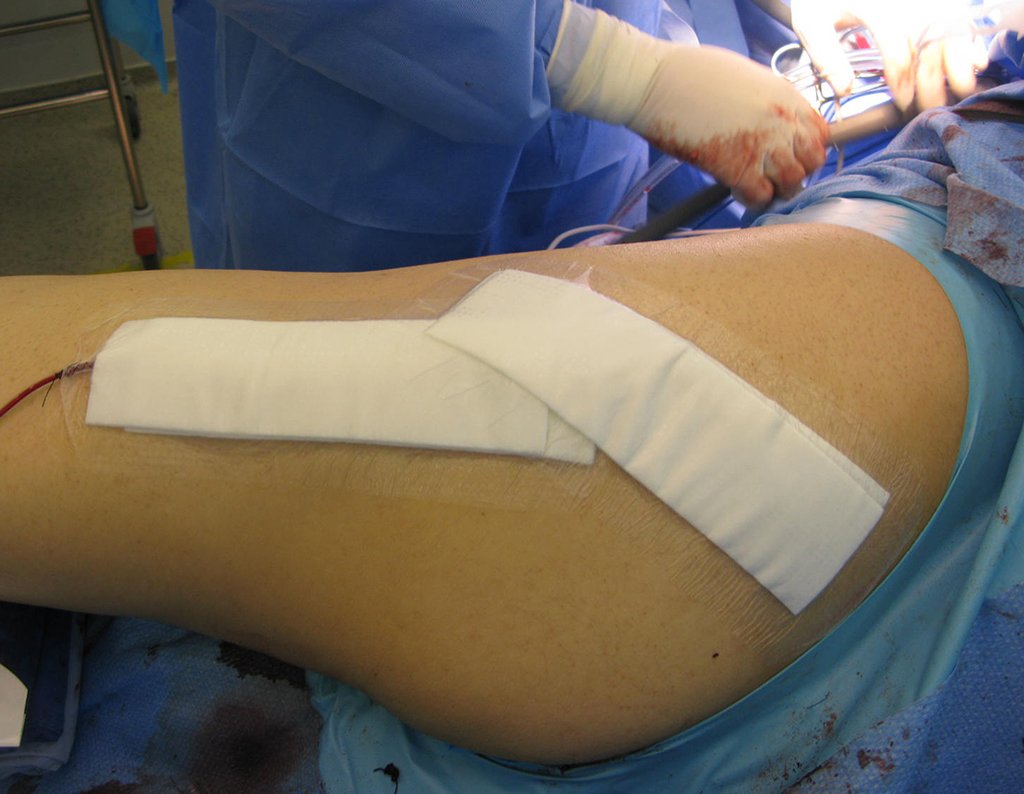
Figura 102: Ferida cirúrgica fechada.
Figure 102: Closed surgical wound.
Figura 103: Curativo oclusivo.
Figure 103: Occlusive dressing.
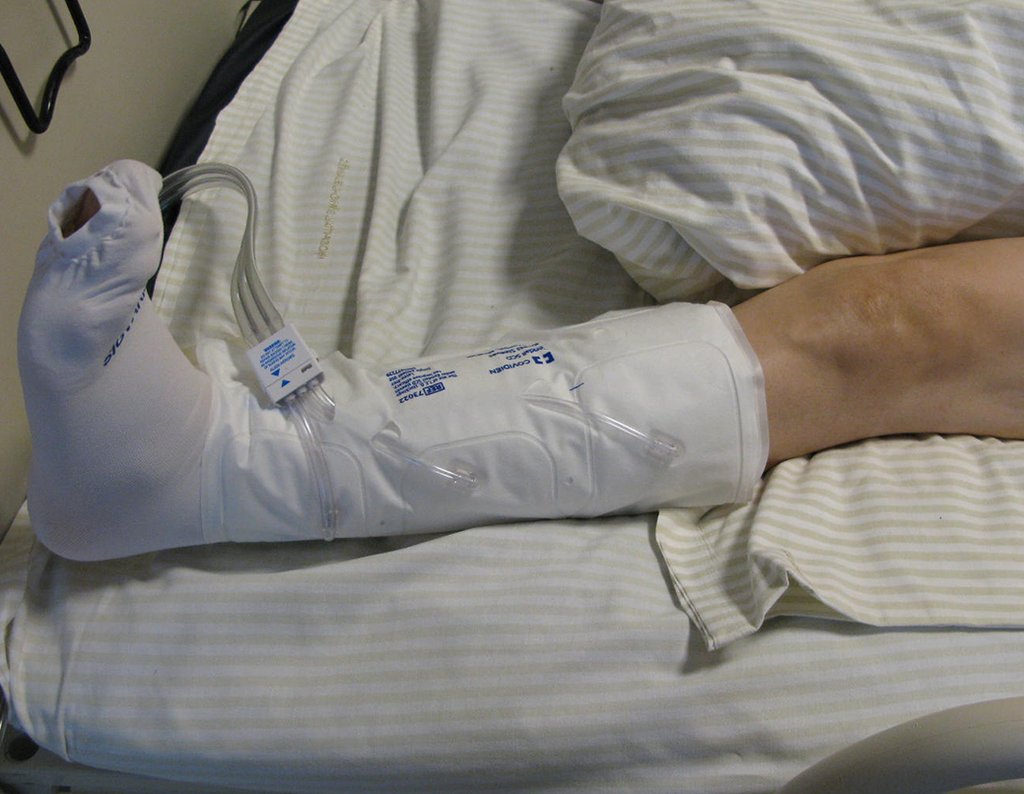
Figura 104: Colocação de triângulo de abdução, meias elásticas e compressor para profilaxia de trombose.
Figure 104: Placement of abduction triangle, elastic stockings and compressor for thrombosis prophylaxis.
Video 12: Guidance on how to perform isometric contractions and active exercises with the lower limbs from the immediate postoperative period.
Video 13: Active flexion of the hips and knees.
Video 14: Active movement of the contralateral limb as well.
Video 15: Starting to walk, fully loaded with the aid of a walker, from the second day after surgery.
Video 16: Walking on the third day after surgery.
Video 17: Third day after surgery.
Figura 105: Prótese modular montada para substituir o segmento ressecado.
Figure 105: Modular prosthesis assembled to replace the resected segment.
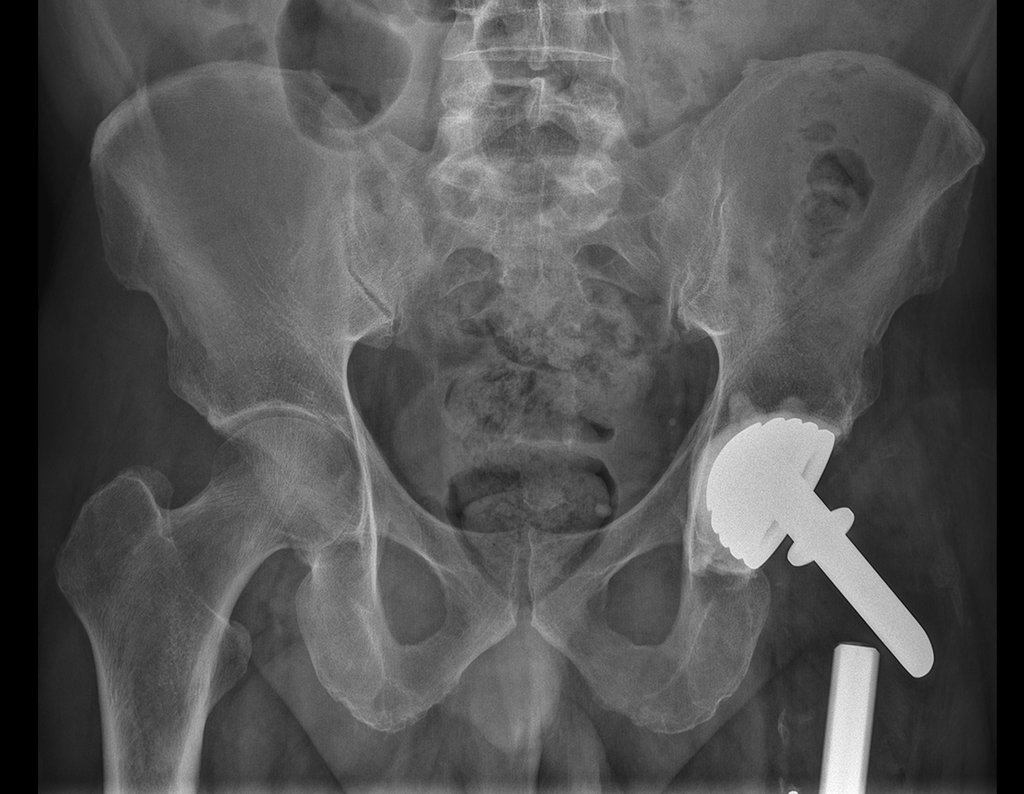
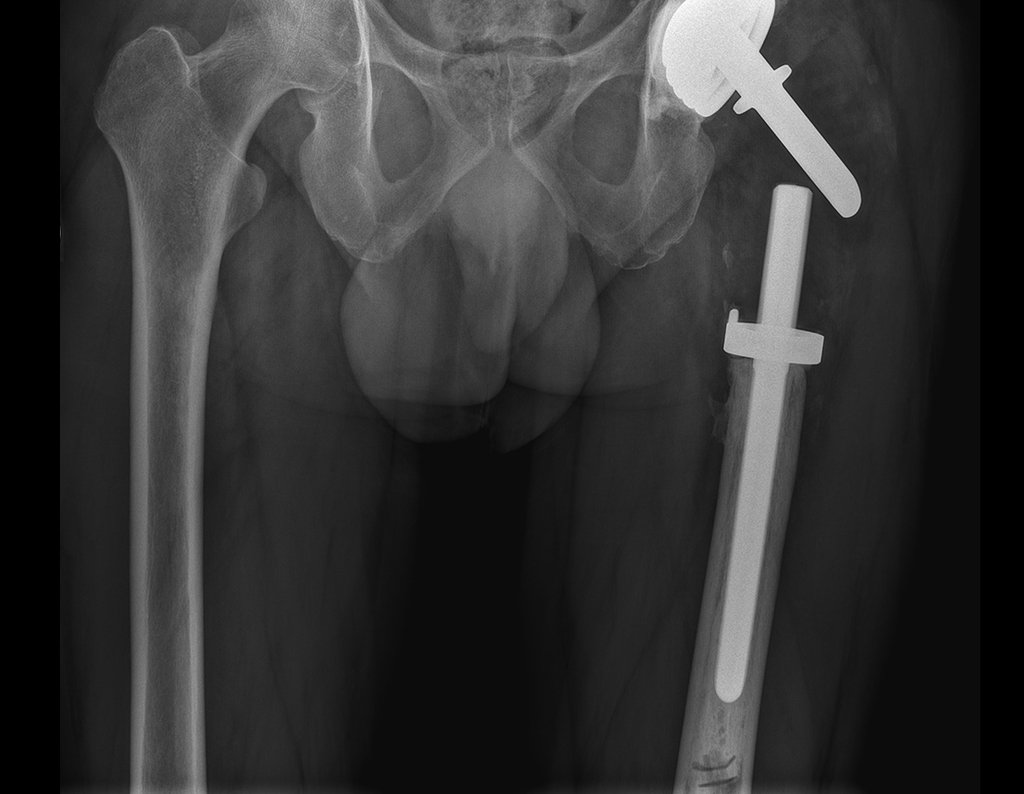
Figura 106: Radiografia do pós-operatório imediato. A seta mostra que a haste do colo não é contínua com a haste femoral. São unidas pelo corpo de polietileno que propicia elasticidade, evitando-se ruptura por stress.
Figure 106: Immediate postoperative radiograph. The arrow shows that the neck stem is not continuous with the femoral stem. They are joined by a polyethylene body that provides elasticity, preventing rupture due to stress.
Figura 107: Peça de ressecção do 1/3 proximal do fêmur esquerdo, face posterior.
Figure 107: Resection piece of the proximal 1/3 of the left femur, posterior surface.
Figura 108: Macroscopia da margem óssea distal.
Figure 108: Macroscopy of the distal bone margin.
Figura 109: Corte coronal da peça com área da cicatriz fibrosa da lesão no calcar femoral e área de rarefação no colo devido à fratura incompleta.
Figure 109: Coronal section of the piece with area of ​​fibrous scar from the lesion in the femoral calcar and area of ​​rarefaction in the neck due to incomplete fracture.
Figura 110: A seta em vermelho aponta a fratura na cortical superior do colo femoral.
Figure 110: The red arrow points to the fracture in the upper cortex of the femoral neck.
Figura 111: O círculo em amarelo evidencia a área da fratura trabecular no colo. A seta em vermelho aponta a ruptura na cortical.
Figure 111: The yellow circle highlights the area of ​​the trabecular fracture in the neck. The red arrow points to the rupture in the cortex.
Figura 112: Traço de fratura incompleta no colo femoral, seta em vermelho, aumento da erosão da cortical medial, entre as setas em amarelo, devido à não regeneração óssea.
Figure 112: Trace of incomplete fracture in the femoral neck, red arrow, increased erosion of the medial cortex, between the yellow arrows, due to non-regeneration of bone.
Figura 113: Fibrose e inflamação.
Figure 113: Fibrosis and inflammation.
Figura 114: Congestão e necrose.
Figure 114: Congestion and necrosis.
Figura 115: Esclerose óssea.
Figure 115: Bone sclerosis.
Figura 116: Laudo da anatomia patológica.
Figure 116: Pathological anatomy report.
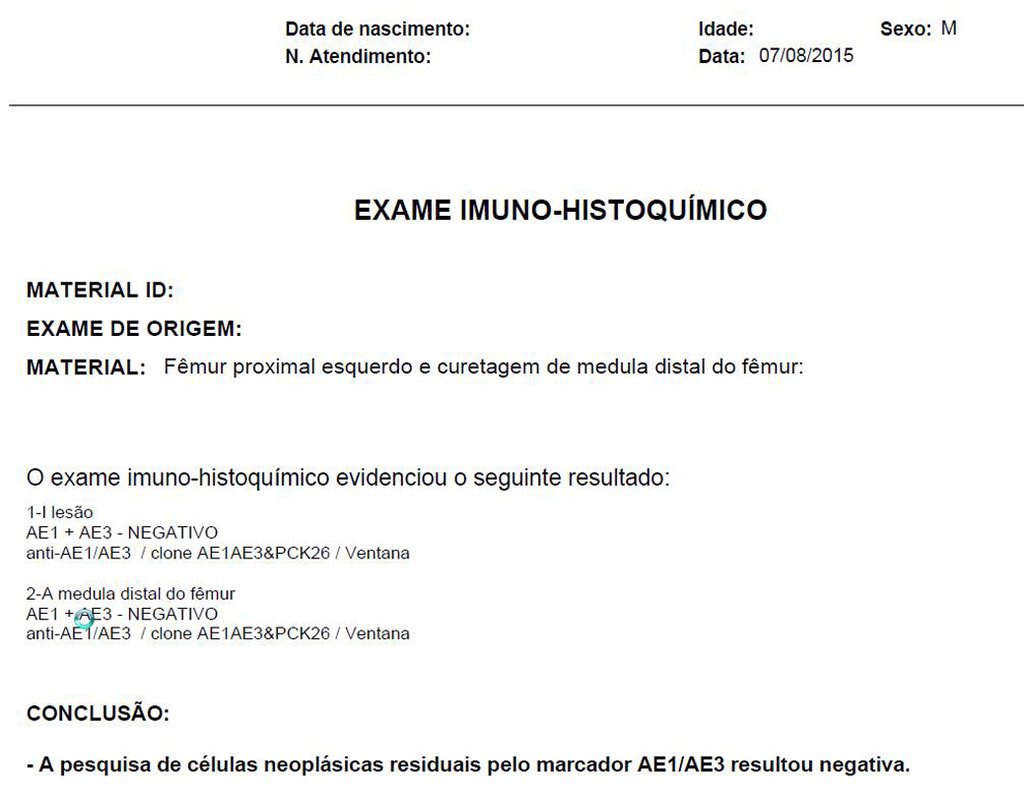
Figura 117: Imuno Histoquímico – marcador epitelial AE1AE3 negativo.
Figure 117: Immune Histochemistry – negative epithelial marker AE1AE3.
Figura 118: Laudo da Imuno Histoquímica.
Figure 118: Immuno Histochemistry Report.
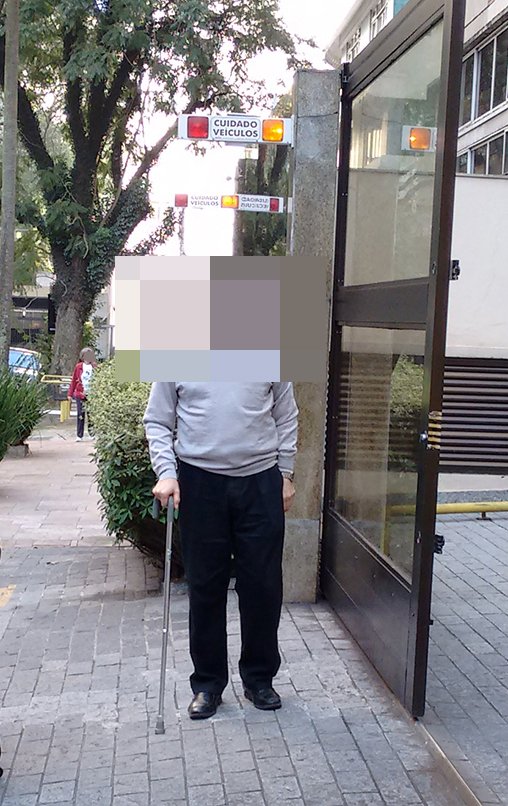
Figura 119: O paciente recebe alta hospitalar no quinto dia após a cirurgia.
Figure 119: The patient is discharged from hospital on the fifth day after surgery.
Figura 120: Cicatriz cirúrgica no décimo dia após a cirurgia. Paciente bem sem queixa.
Figure 120: Surgical scar on the tenth day after surgery. Patient well without complaints.
Figura 121: Retirada dos pontos no décimo dia após a cirurgia.
Figure 121: Removal of stitches on the tenth day after surgery.
Video 18: Patient in the office, on the tenth day after surgery, on 08/07/2015.
Figura 122: Paciente com sete semanas de cirurgia.
Figure 122: Patient seven weeks after surgery.
Figura 123: Cicatriz cirúrgica após sete semanas.
Figure 123: Surgical scar after seven weeks.
Figura 124: Radiografia do quadril, frente, após sete semanas.
Figure 124: X-ray of the hip, front, after seven weeks.
Figura 125: Radiografia do quadril, perfil, em 17/09/2015.
Figure 125: X-ray of the hip, profile, on 09/17/2015.
Video 19: Patient without complaints, working and walking with the aid of a cane, on 09/17/2015, seven weeks postoperatively.
Figura 126: Radiografia de bacia, em 03/08/2017.
Figure 126: Basin radiograph, on 08/03/2017.
Figura 127: Radiografia de 1/2 proximal do fêmur, em 03/08/2017.
Figure 127: Radiograph of the proximal 1/2 of the femur, on 08/03/2017.
Video 20: Patient without complaints, well, walking with discreet Trendelenburg, on 08/03/2017, two years after surgery.

Author: Prof. Dr. Pedro Péricles Ribeiro Baptista

 Orthopedic Oncosurgery at the Dr. Arnaldo Vieira de Carvalho Cancer Institute

Leave a Reply

Hello! How can we assist you?