This digital library houses the book on Oncology and Orthopedic Oncosurgery.

It includes academic lectures, presentations from national and international congresses, published papers, case discussions, performed surgical procedures, and proprietary techniques developed.

The digital format was chosen because the web allows the inclusion of texts with numerous visual resources, such as images and videos, which would not be possible in a printed book.

The content is intended for students, healthcare professionals, and the general public interested in the field.

Radioablation In Calcaneal Osteoid Osteoma

13b0c579c1bdc8439ab3de83b480ccf6 3

Radioablation in calcaneal osteoid osteoma – Resection and reconstruction technique with autologous graft

Figura 1: Radiografia do tornozelo frente.
Figure 1: Radiograph of the front ankle.
Figura 2: Radiografia do tornozelo perfil, revelando esclerose no calcâneo esquerdo.
Figure 2: Radiograph of the lateral ankle, revealing sclerosis in the left calcaneus.
Figura 3: A radiografia do tornozelo em perfil, com penetração adequada, evidencia a esclerose e destaca um nicho central.
Figure 3: An x-ray of the ankle in profile, with adequate penetration, shows sclerosis and highlights a central niche.
Figura 4: Cintilografia óssea apresenta hiperconcentração no calcâneo, já na fase de fluxo.
Figure 4: Bone scintigraphy shows hyperconcentration in the calcaneus, already in the flow phase.
Figura 5: Cintilografia, na fase de equilíbrio, com evidente captação no calcâneo.
Figure 5: Scintigraphy, in the equilibrium phase, with evident uptake in the calcaneus.
Figura 6: Cintilografia óssea, na fase tardia, constata tratar-se de lesão única.
Figure 6: Bone scintigraphy, in the late phase, confirms that it is a single lesion.
Figura 7: Cintilografia na fase tardia, localizada, evidencia a intensa captação.
Figure 7: Scintigraphy in the late, localized phase, showing intense uptake.
Figura 8: Laudo da cintilografia óssea, com hipercaptação no calcâneo, sugere osteoma osteóide.
Figure 8: Bone scintigraphy report, with high uptake in the calcaneus, suggests osteoid osteoma.
To better study the lesion, a bone tomography examination was performed, figures 9 to 14.
Figura 9: TC evidenciando a lesão na região posterior do calcâneo.
Figure 9: CT showing the lesion in the posterior region of the calcaneus.
Figura 10: TC com lesão lítica, na face lateral do calcâneo, com halo de esclerose.
Figure 10: CT scan with lytic lesion, on the lateral aspect of the calcaneus, with a halo of sclerosis.
Figura 11: TC, densidade para tecidos moles.
Figure 11: CT, density for soft tissues.
Figura 12: TC, densidade para tecidos moles, lesão lítica, menor que 1 cm.
Figure 12: CT, soft tissue density, lytic lesion, smaller than 1 cm.
Figura 13: Laudo da TC do pé esquerdo.
Figure 13: CT report of the left foot.
Figura 14: Laudo da TC do pé esquerdo - Continuação.
Figure 14: CT report of the left foot - Continued.
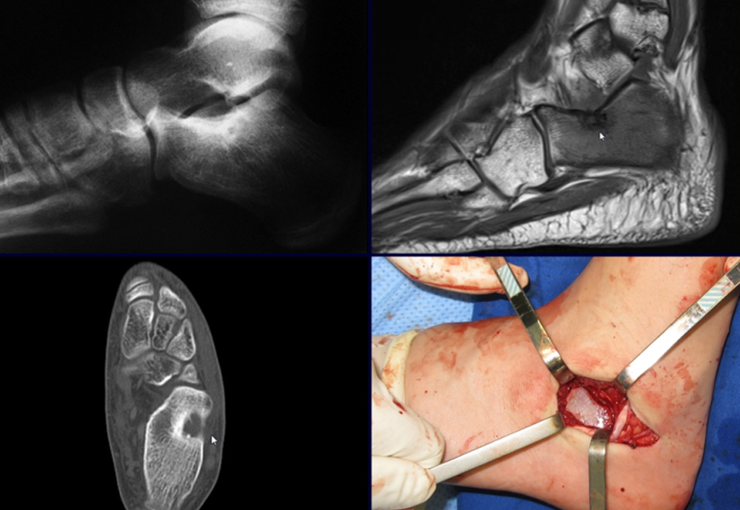
With the diagnostic hypothesis of osteoid osteoma, the orthopedist who accompanied him recommended treatment with radiotherapy. In April 2014, he underwent radioablation. During the first three months he used painkillers intermittently. Four months after radioablation, due to the persistence of the painful condition, he underwent a new tomography on 08/17/2014. The images from this computed tomography, after radioablation, are analyzed in figures 15 to 20.
Figura 15: TC de perfil, evidenciando a lesão no calcâneo esquerdo.
Figure 15: Profile CT, showing the lesion in the left calcaneus.
Figura 16: TC evidenciando a lesão no calcâneo esquerdo conforme indicação da seta.
Figure 16: CT showing the lesion in the left calcaneus as indicated by the arrow.
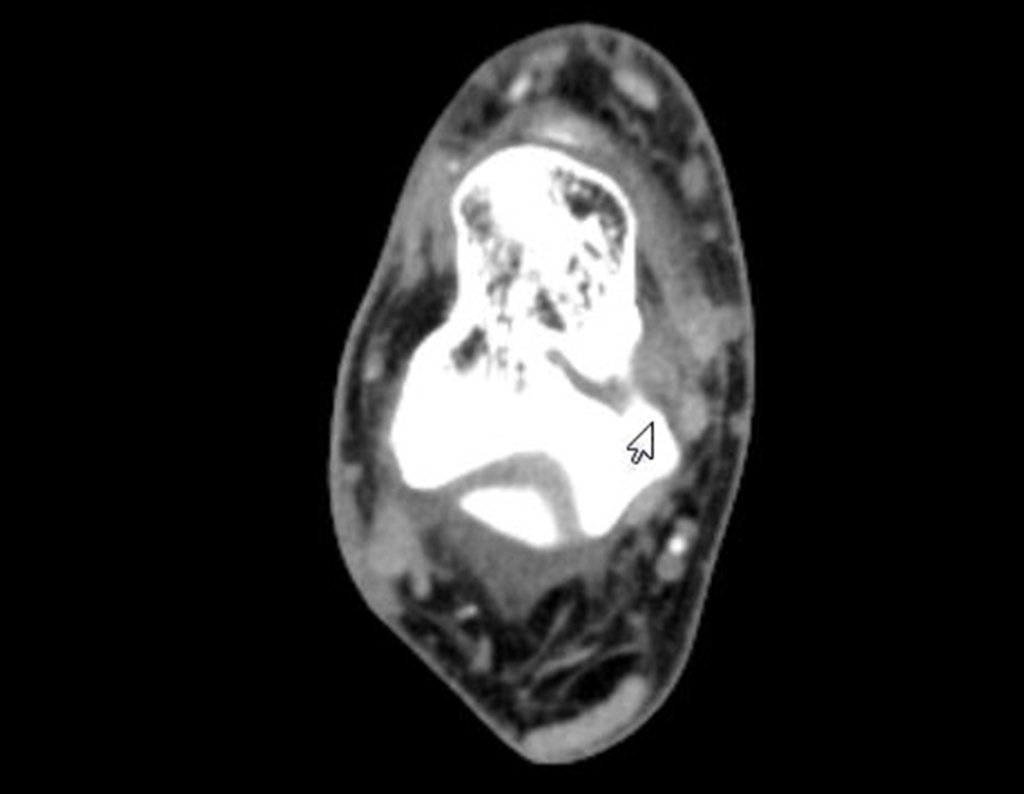
Figura 17: TC, corte axial, com a presença da imagem lítica e halo de esclerose.
Figure 17: CT, axial section, with the presence of the lytic image and sclerosis halo.
Figura 18: TC, densidade para tecidos moles, edema e reação inflamatória na face lateral do calcâneo.
Figure 18: CT, soft tissue density, edema and inflammatory reaction on the lateral aspect of the calcaneus.
What is the meaning of this image? Scar? Persistence of the injury? Does the patient still have the same symptoms?
Figura 19: TC, reconstrução tridimensional, a seta destaca a topografia da lesão no calcâneo.
Figure 19: CT, three-dimensional reconstruction, the arrow highlights the topography of the calcaneal lesion.
Figura 20: Laudo da TC do calcâneo esquerdo.
Figure 20: CT report of the left calcaneus.
Analgesic physiotherapy and medication change indicated. Without improvement in symptoms, an MRI was performed to better assess the condition.
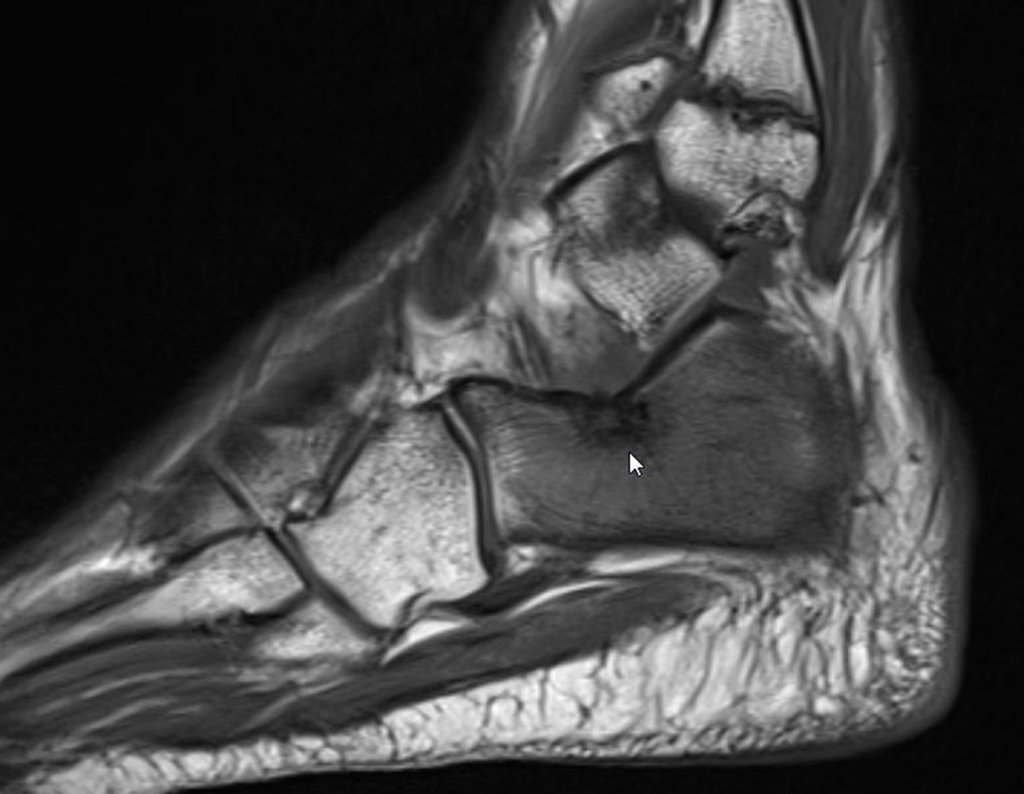
Figura 21: RM sag T1, evidenciando a presença da lesão - seta branca.
Figure 21: T1 sag MRI, showing the presence of the lesion - white arrow.
Figura 22: RM sag T1, corte mais superficial, a seta branca aponta o local da alteração óssea.
Figure 22: T1 sag MRI, more superficial section, the white arrow points to the location of the bone change.
Figura 23: RM axial T1, lesão na região lateral do calcâneo.
Figure 23: Axial T1 MRI, lesion in the lateral region of the calcaneus.
Figura 24: RM axial T1, detalhe do halo de esclerose ao redor da lesão.
Figure 24: Axial T1 MRI, detail of the sclerosis halo around the lesion.
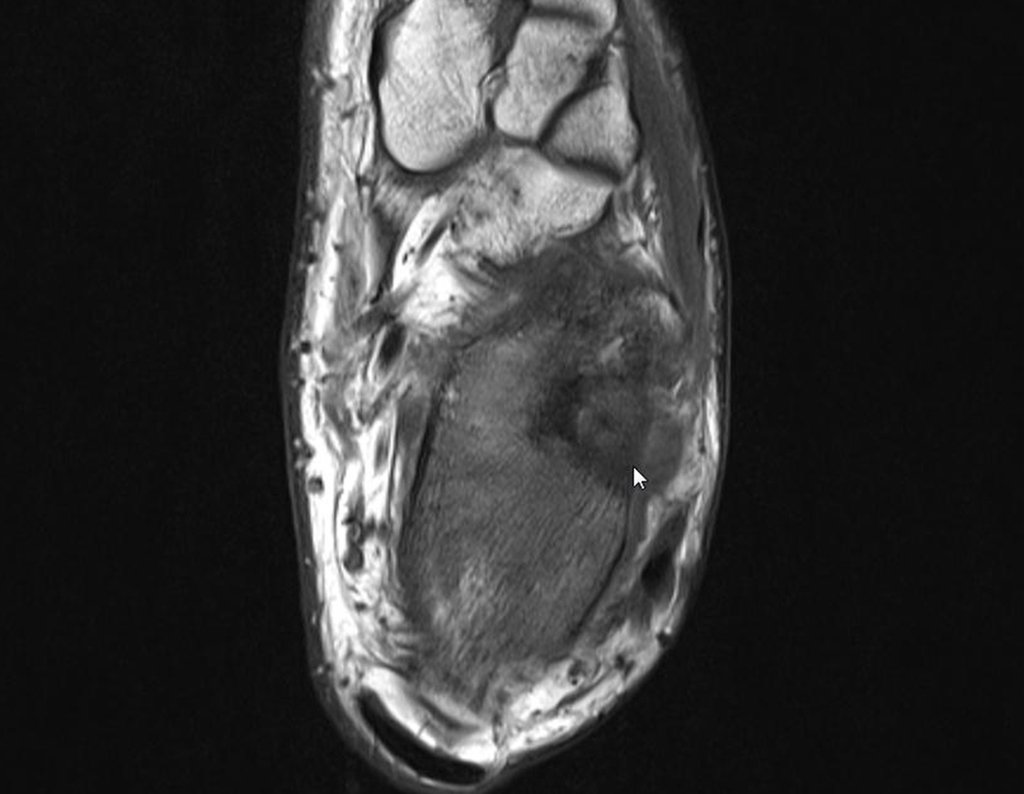
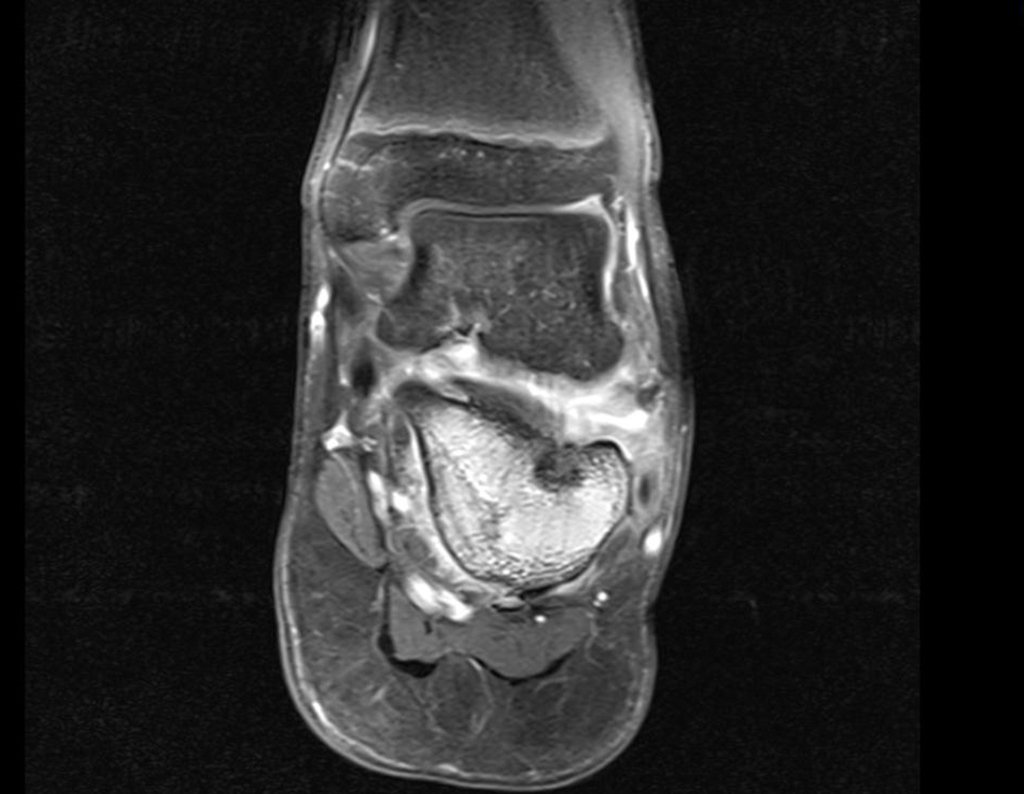
Figura 25: RM coronal T1, lesão com halo de esclerose, nicho central e edema articular.
Figure 25: Coronal T1 MRI, lesion with halo of sclerosis, central niche and joint edema.
Figura 26: Ressonância coronal T1, fat sat, com lesão no calcâneo e edema articular, objetivando a sintomatologia.
Figure 26: Coronal T1 resonance, fat sat, with lesion in the calcaneus and joint edema, identifying the symptoms.
Figura 27: RM sag T2 stir, lesão e edema do calcâneo.
Figure 27: T2 stir sag MRI, calcaneal injury and edema.
Figura 28: RM sag T2 stir, permanência da lesão e edema.
Figure 28: MRI sag T2 stir, lesion permanence and edema.
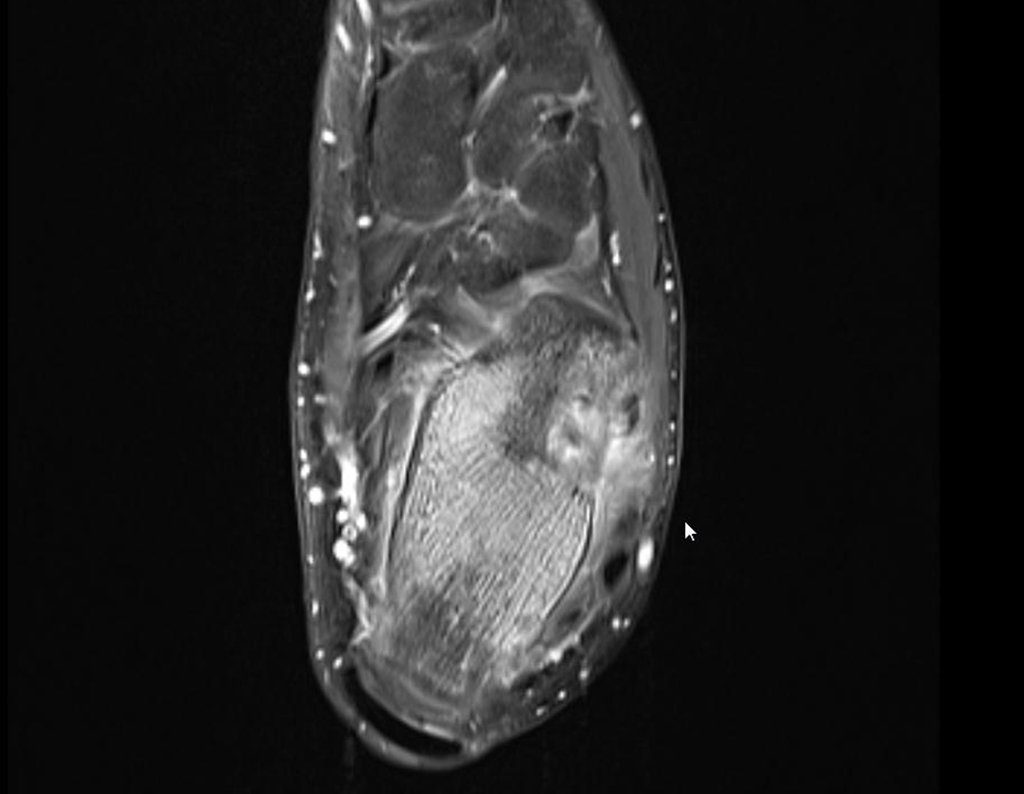
Figura 29: RM axial T1, fat sat, com lesão na porção lateral do calcâneo e edema extraósseo.
Figure 29: Axial T1 MRI, fat sat, with lesion in the lateral portion of the calcaneus and extraosseous edema.
Figura 30: RM axial T1, lesão com halo de esclerose.
Figure 30: Axial T1 MRI, lesion with sclerosis halo.
Figura 31: RM cor T2 stir, com evidente alteração articular.
Figure 31: MRI color T2 stir, with evident joint changes.
Figura 32: RM cor T2 stir, com a imagem da lesão semelhante à antes do tratamento.
Figure 32: T2 stir color MRI, with the image of the lesion similar to that before treatment.
Figura 33: RM axial T2 stir, halo de esclerose, lesão e edema articular.
Figure 33: Axial T2 stir MRI, halo of sclerosis, lesion and joint edema.
Figura 34: RM axial T2 stir, continuidade da lesão.
Figure 34: Axial T2 stir MRI, continuity of the lesion.
The patient is referred for a second opinion, being evaluated in December 2014, figures 35 to 39.
Figura 35: Laudo da ressonância magnética de 26 de outubro de 2014.
Figure 35: MRI report from October 26, 2014.
Figura 37: Aspecto clínico do tornozelo com a cicatriz da radioablação, aumento da vascularização e edema do tornozelo.
Figure 36: Mild swelling in the left ankle and pain. Figure 37: Clinical appearance of the ankle with the radioablation scar, increased vascularization and ankle edema.
Figura 38: Paciente com hipotrofia da perna esquerda.
Figure 38: Patient with hypotrophy of the left leg.
Figura 39: Radiografia do tornozelo esquerdo em perfil, com lesão condensante no calcâneo, região subtalar.
Figure 39: Radiograph of the left ankle in profile, with a condensing lesion in the calcaneus, subtalar region.
Figura 40: Radiografia do tornozelo esquerdo, oblíqua, em 13/01/2015.
Figure 40: Radiograph of the left ankle, oblique, on 01/13/2015.
After careful analysis of the case and with unsatisfactory progress, the patient underwent surgery in January 2015, to resect the lesion and place an autologous iliac graft.
Figura 41: Posição do tornozelo no intra-operatório, que é operado sem garroteamento do membro.
Figure 41: Intraoperative position of the ankle, which is operated without tourniqueting the limb.
Figura 42: Incisão horizontal na região do calcâneo, apenas na pele e subcutâneo, visualizando-se a vascularização da região e realizando cuidadosa hemostasia.
Figure 42: Horizontal incision in the calcaneal region, only in the skin and subcutaneous tissue, visualizing the vascularization of the region and performing careful hemostasis.
Figura 43: Exposição da hemostasia, os pontos em preto representam a cauterização dos vasos. Não há sangramento no campo cirúrgico, vascularização da região e realização de cuidadosa hemostasia.
Figure 43: Exposure of hemostasis, the black dots represent the cauterization of the vessels. There is no bleeding in the surgical field, vascularization of the region and careful hemostasis.
Figura 44: Liberação e afastamento no nervo fíbulo calcâneo, com seus ramos.
Figure 44: Release and separation in the calcaneal fibula nerve, with its branches.
Figura 45: Isolamento do tendão.
Figure 45: Tendon isolation.
Figura 46: Visualização do tendão tibial posterior.
Figure 46: Visualization of the posterior tibial tendon.
Figura 47: Exposição do local da lesão, campo cirúrgico sem sangramento, boa hemostasia.
Figure 47: Exposure of the injury site, surgical field without bleeding, good hemostasis.
Figura 48: Osteotomia com formão curvo, contornando a lesão do calcâneo.
Figure 48: Osteotomy with curved chisel, bypassing the calcaneal lesion.
Figura 49: Aspecto após ressecção da lesão do calcâneo.
Figure 49: Appearance after resection of the calcaneal lesion.
Figura 50: Radiografia do pé esquerdo frente, antes da colocação do enxerto do Ilíaco. As setas vermelhas delimitam o comprimento da área ressecada, e a seta amarela assinala a profundidade do bloco ressecado.
Figure 50: Radiograph of the front left foot, before placement of the iliac graft. The red arrows delimit the length of the resected area, and the yellow arrow indicates the depth of the resected block.
The removal of an iliac graft must also be performed with surgical access and adequate hemostasis. To do this, it is necessary to incise the skin above the iliac crest, only the skin and subcutaneous tissue, perform careful hemostasis with electrocautery and retract the skin distally, bypassing the insertion of the abdominal oblique muscle. This must be removed from the ridge, as if we were “ roaring ” the bone with an electric scalpel. You should not cut the muscle , as beginner surgeons usually do, as there will be bleeding. This way we can achieve broad, safe access without unnecessary blood loss, figures 51 to 58.
Figura 51: Incisão no Ilíaco esquerdo, para a retirada de enxerto.
Figure 51: Incision in the left iliac bone, for graft removal.
Figura 52: Exposição da inserção do músculo oblíquo na crista ilíaca. Observe com atenção que não há sangramento no campo cirúrgico.
Figure 52: Exposure of the insertion of the oblique muscle into the iliac crest. Observe carefully that there is no bleeding in the surgical field.
Figura 53: As setas assinalam a desinserção do músculo oblíquo do abdome, sem sangramento.
Figure 53: The arrows indicate the disinsertion of the abdominal oblique muscle, without bleeding.
Figura 54: Em detalhe, a crista do ilíaco sendo "ruginada" com o eletrocautério, na desinserção do músculo.
Figure 54: In detail, the iliac crest being "roared" with the electrocautery, when detaching the muscle.
Figura 55: Continua-se na tábua interna com o descolamento do periósteo e o perimísio do músculo oblíquo.
Figure 55: Continues on the inner table with the detachment of the periosteum and the perimysium of the oblique muscle.
Figura 56: Aspecto após a retirada do enxerto do Ilíaco esquerdo. A seta aponta o periósteo da tábua interna do ilíaco aderido ao perimísio do músculo ilíaco.
Figure 56: Appearance after removal of the left iliac graft. The arrow points to the periosteum of the internal table of the iliac attached to the perimysium of the iliac muscle.
Figura 57: Praticamente sem perda sanguínea, colocação de hemostático para tecido ósseo.
Figure 57: Practically no blood loss, placement of hemostatic for bone tissue.
Figura 58: Colocação de hemostático de tecidos moles no local da retirada do enxerto do Ilíaco e reinserção do músculo ilíaco.
Figure 58: Placement of a soft tissue hemostat at the site of removal of the iliac graft and reinsertion of the iliac muscle.
Figura 59: Bloco de enxerto retirado do ilíaco, mostrando a tábua interna e parte da crista ilíaca.
Figure 59: Graft block removed from the iliac, showing the internal table and part of the iliac crest.
Figura 60: Bloco de enxerto do ilíaco, lado do osso esponjoso que foi separado da tábua externa. A tábua externa do osso ilíaco é totalmente preservada, mantendo-se o contorno anatômico da pelve.
Figure 60: Iliacus graft block, side of the cancellous bone that was separated from the outer table. The external table of the iliac bone is completely preserved, maintaining the anatomical contour of the pelvis.
Figura 61: Preparo do bloco ósseo de enxerto autólogo, retirando-se o tecido cartilaginoso da parte da crista ilíaca deste enxerto.
Figure 61: Preparation of the autologous bone graft block, removing the cartilaginous tissue from the iliac crest part of this graft.
Figura 62: Cartilagem do enxerto praticamente retirada.
Figure 62: Graft cartilage practically removed.
Video 1: Preparing the graft.
Figura 63: Cavidade do calcâneo, após a ressecção da lesão, que vai ser reconstruída com a colocação do enxerto autólogo do ilíaco, já preparado.
Figure 63: Calcaneal cavity, after resection of the lesion, which will be reconstructed with the placement of the already prepared autologous iliac graft.
Figura 64: Enxerto do ilíaco sendo colocado. A seta amarela assinala o enxerto modelado com o contorno da abertura da cavidade, criada coma retirada da lesão.
Figure 64: Iliac graft being placed. The yellow arrow marks the graft modeled with the contour of the cavity opening, created by removing the lesion.
Figura 65: Enxerto posicionado e modelagem conferida.
Figure 65: Graft positioned and modeling checked.
Figura 66: Enxerto já colocado e impactado na cavidade. Boa modelagem e boa fixação.
Figure 66: Graft already placed and impacted in the cavity. Good modeling and good fixation.
Figura 67: Colocação de hemostático de tecidos moles e fechamento da ferida operatória.
Figure 67: Placement of soft tissue hemostat and closure of the surgical wound.
Figura 68: Radiografia do pós-operatório imediato, após a colocação do enxerto do Ilíaco. O círculo em amarelo evidencia a reconstituição da anatomia do calcâneo, a seta vermelha destaca o enxerto colocado.
Figure 68: Radiograph of the immediate postoperative period, after placement of the iliac graft. The yellow circle highlights the reconstitution of the calcaneal anatomy, the red arrow highlights the graft placed.
The calcaneus is a load-bearing bone, and its reconstruction with autologous bone graft has the best integration, allowing early recovery of the patient’s function.
Figura 69: Radiografia do pós-operatório imediato, em perfil, após a colocação do enxerto autólogo do Ilíaco.
Figure 69: Radiograph of the immediate postoperative period, in profile, after placement of the autologous iliac graft.
Figura 70: Paciente com imobilizador de tornozelo, após cirurgia.
Figure 70: Patient with ankle immobilizer after surgery.
Return to the office 8 days after surgery.
Figura 71: Aspecto da ferida no pós-operatório de 8 dias.
Figure 71: Appearance of the wound 8 days after surgery.
Figura 72: Detalhe da cicatrização.
Figure 72: Detail of healing.
Figura 73: Pós-operatório de um mês, em 25/02/2015.
Figure 73: One month post-operative, on 02/25/2015.
Figura 74: Avaliação após 30 dias. Detalhe da cicatriz.
Figure 74: Assessment after 30 days. Scar detail.
Video 2: Six weeks post-operative, on 02/25/2015.
Video 3: Normal ankle mobility.
Figura 75: Cicatriz do ilíaco esquerdo, área de retirada de enxerto, em março de 2015.
Figure 75: Left iliac scar, graft removal area, in March 2015.
Figura 76: Radiografia de 01/03/2015, frente, enxerto consolidado, em integração.
Figure 76: Radiograph from 03/01/2015, front, consolidated graft, in integration.
Figura 77: Radiografia de 01/03/2015, perfil, enxerto em integração.
Figure 77: Radiograph from 03/01/2015, profile, graft in integration.
Video 4: Patient walking with full load – three months post-operative.

Author: Prof. Dr. Pedro Péricles Ribeiro Baptista

 Orthopedic Oncosurgery at the Dr. Arnaldo Vieira de Carvalho Cancer Institute

Leave a Reply

Hello! How can we assist you?