This digital library houses the book on Oncology and Orthopedic Oncosurgery.

It includes academic lectures, presentations from national and international congresses, published papers, case discussions, performed surgical procedures, and proprietary techniques developed.

The digital format was chosen because the web allows the inclusion of texts with numerous visual resources, such as images and videos, which would not be possible in a printed book.

The content is intended for students, healthcare professionals, and the general public interested in the field.

Osteoid osteoma – Gammagraphy

Osteoid Osteoma - Gammagraphy-guided surgery

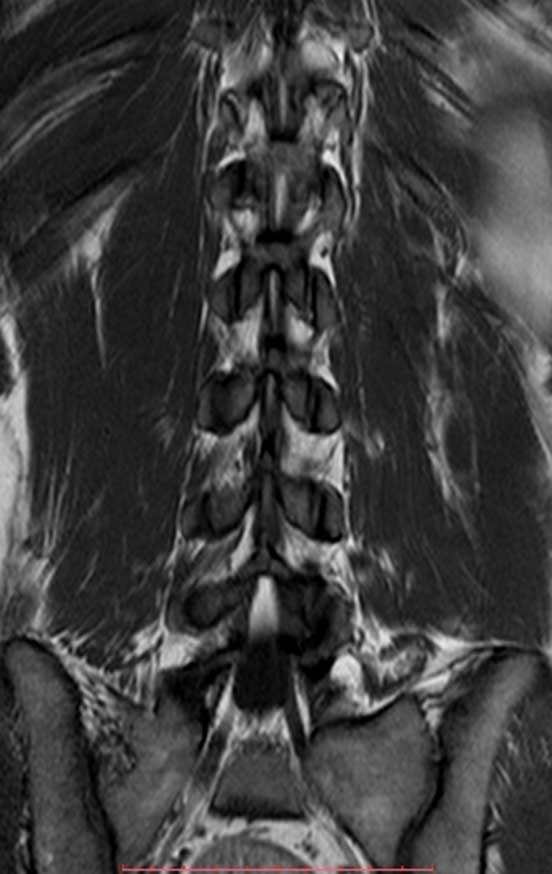
Osteoid osteoma – Gammagraphy. A 23-year-old patient reports pain in the right thigh for three months, more intense at night and showing slight improvement with anti-inflammatories. He underwent MRI of the lumbar spine and hip in April 2015, figures 1 to 8.
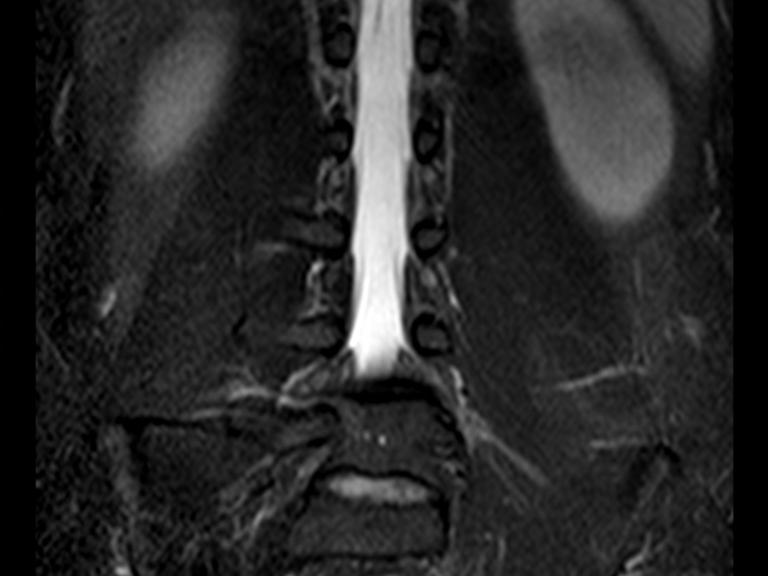
Figura 1: Ressonância magnética da coluna lombar.
Figure 1: Magnetic resonance imaging of the lumbar spine.
Figura 2: Ressonância, coronal T1 da coluna lombar, sem alteração.
Figure 2: Coronal T1 resonance of the lumbar spine, no change.
Figura 3: Ressonância da coluna lombar coronal T2, sem alteração.
Figure 3: T2 coronal lumbar spine resonance, no change.
Figura 4: Rm coronal T1 com contraste revelando captação na região antero medial do fêmur direito. Em detalhe destaca-se o ramo transverso da artéria circunflexa anterior, seta em vermelho.
Figure 4: Coronal T1 MRI with contrast revealing uptake in the anteromedial region of the right femur. In detail, the transverse branch of the anterior circumflex artery stands out, arrow in red.
Figura 5: Ressonância axial T1 com contraste evidencia nidus na face anterior da cortical femoral, delimitada por halo de esclerose óssea e captação de contraste.
Figure 5: Axial T1 MRI with contrast shows nidus on the anterior surface of the femoral cortex, delimited by a halo of bone sclerosis and contrast uptake.
Figura 6: Ressonância coronall T1 com captação de contraste na região antero medial do fêmur direito, destacando segmento descendente da artéria circunflexa medial.
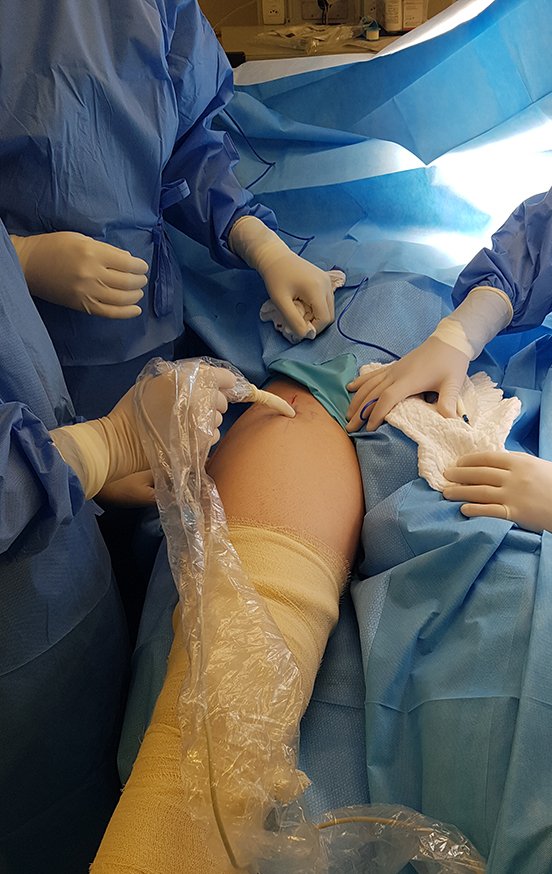
Figure 6: Coronal T1 MRI with contrast capture in the anteromedial region of the right femur, highlighting the descending segment of the medial circumflex artery.
Figura 7: Ressonância magnética do quadril revelando a presença de lesão, sugestiva de osteoma osteóide.
Figure 7: Magnetic resonance imaging of the hip revealing the presence of a lesion, suggestive of osteoid osteoma.
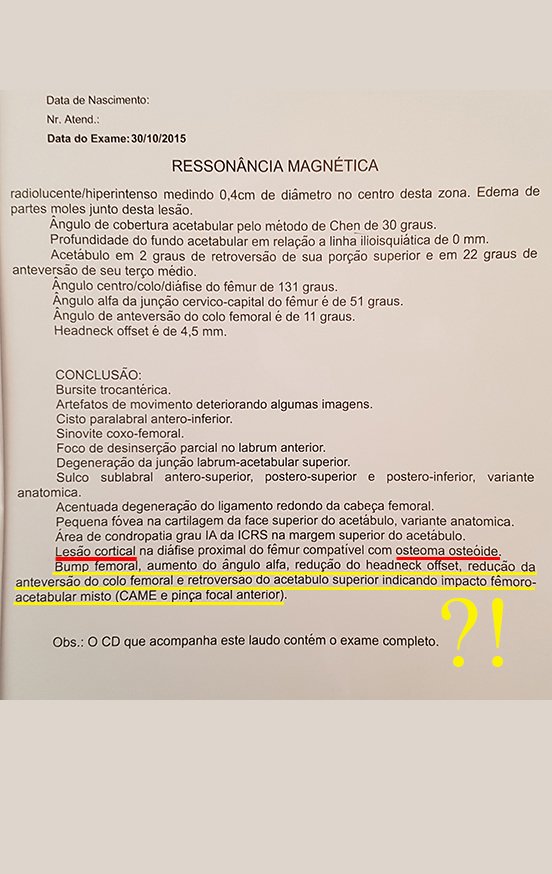
Figura 8: Laudo de ressonância relatando hipóteses diagnósticas. A seta vermelha salienta a hipótese de osteoma osteoide.
Figure 8: MRI report reporting diagnostic hypotheses. The red arrow highlights the hypothesis of osteoid osteoma.

The MRI report at that time reported the diagnostic hypothesis of osteoid osteoma. 

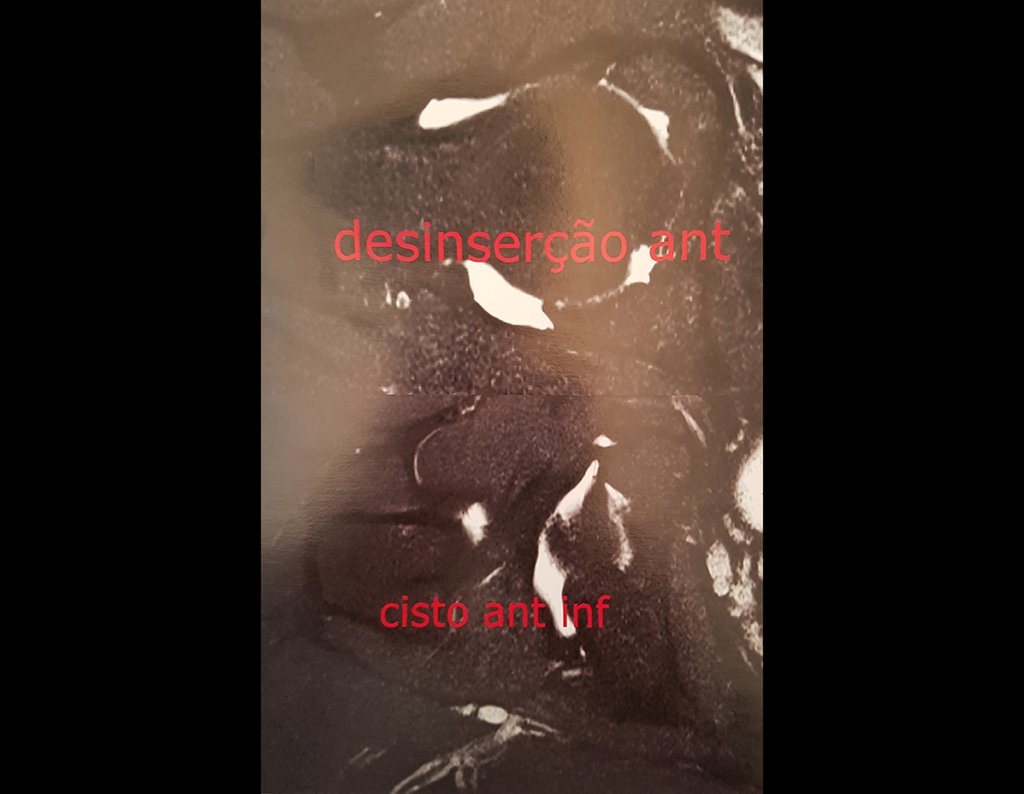
However, after four months, an arthro resonance imaging examination was performed in August 2015, which inferred the possibility of femoroacetabular impingement, figures 9 and 10.

Figura 9: Artrorressonância magnética de agosto de 2015 sugerindo no relatório lesão labral ?!
Figure 9: Magnetic resonance imaging from August 2015 suggesting labral injury in the report?!
Figura 10: Laudo de artrorressonância magnética que sugere impacto fêmoro-acetabular !
Figure 10: Magnetic resonance arthrography report that suggests femoro-acetabular impingement!
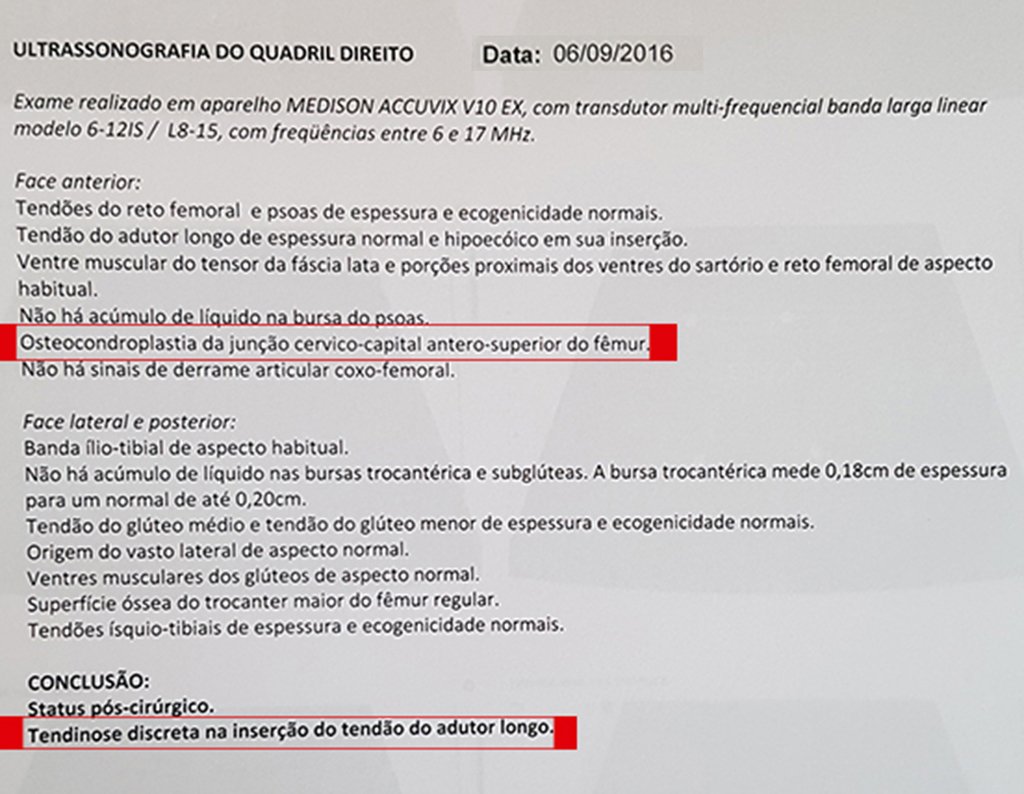
Subsequently, an ultrasound was performed on September 6, 2016, and a new hip resonance was performed on September 22, 2016, figures 11 and 12.
Figura 11: Ultrassonografia do quadril direito, em 06/09/2016
Figure 11: Ultrasonography of the right hip, on 09/06/2016
Figura 12: Ressonância da coxa direita em 22/09/2016
Figure 12: MRI of the right thigh on 09/22/2016
Figura 13: Ressonância magnética do quadril direito, em 22/09/2016
Figure 13: Magnetic resonance imaging of the right hip, on 09/22/2016
The following month, in October 2016, a new hip resonance was performed, which reconfirmed the presence of the neoplastic lesion, arrows in red, in addition to inferring femoro-acetabular impact, figures 14 to 21.
Figura 14: Ressonância magnética em 30/10/2017.
Figure 14: Magnetic resonance imaging on 10/30/2017.
Figura 15: Ressonância magnética de 30/10/2017 evidenciando captação na face antero laterlal do fêmur direito, seta em vermelho.
Figure 15: Magnetic resonance imaging on 10/30/2017 showing capture on the anterolateral surface of the right femur, arrow in red.
Figura 16: Ressonância axial contrastando o nicho na cortical, já visualizado nos exames anteriores.
Figure 16: Axial resonance contrasting the cortical niche, already visualized in previous exams.
Figura 17: Artrorresonância ainda investigando a dor do paciente, realizada em outubro de 2016.
Figure 17: MRI still investigating the patient's pain, carried out in October 2016.
Figura 19: Artrorresonância coronale, outubro de 2016.
Figure 18: Axial MRI to evaluate the hip joint, performed in October 2016.
Figure 19: Coronal MRI, October 2016.
Figura 20: Laudo da artrorressonância de outubro de 2016, em destaque a descrição da presença do nidus.
Figure 20: MRI report from October 2016, highlighting the description of the presence of the nidus.
Figura 21: Laudo da artrorressonância de outubro de 2016, citando a lesão cortical, osteoma osteóide.
Figure 21: MRI report from October 2016, citing the cortical lesion, osteoid osteoma.
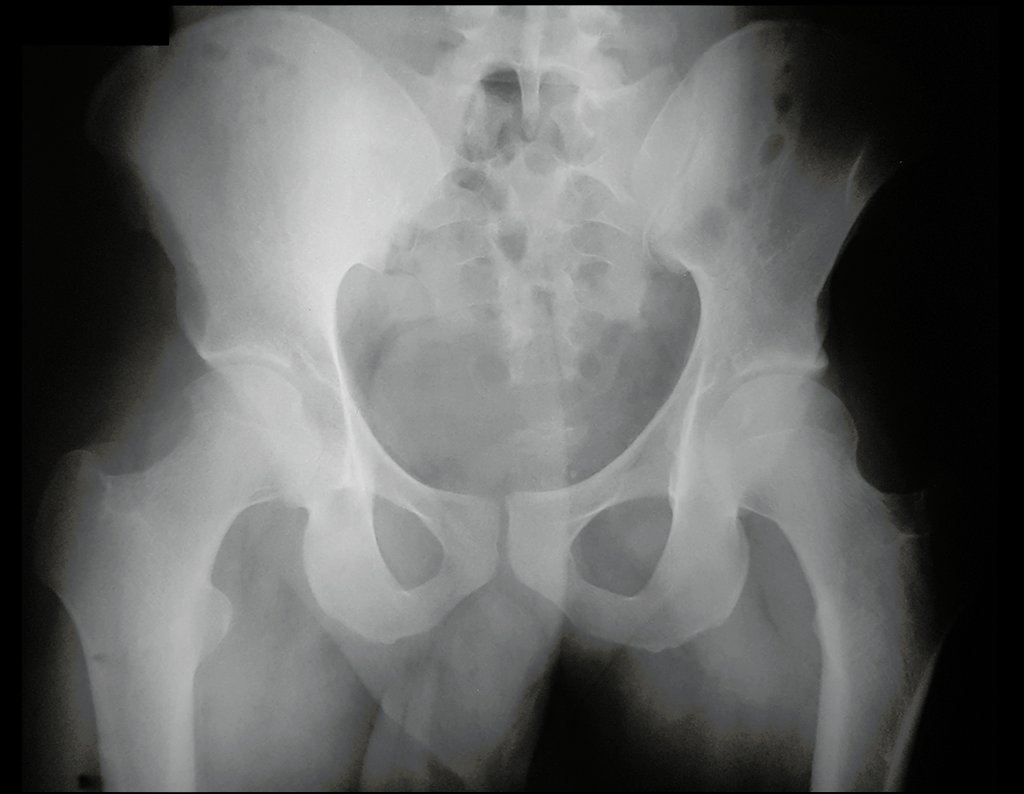
Figura 22: Radiografia da bacia, frente, realizada em 08/12/2016, para controle de infiltração articular.
Figure 22: X-ray of the pelvis, front, taken on 12/08/2016, to control joint infiltration.
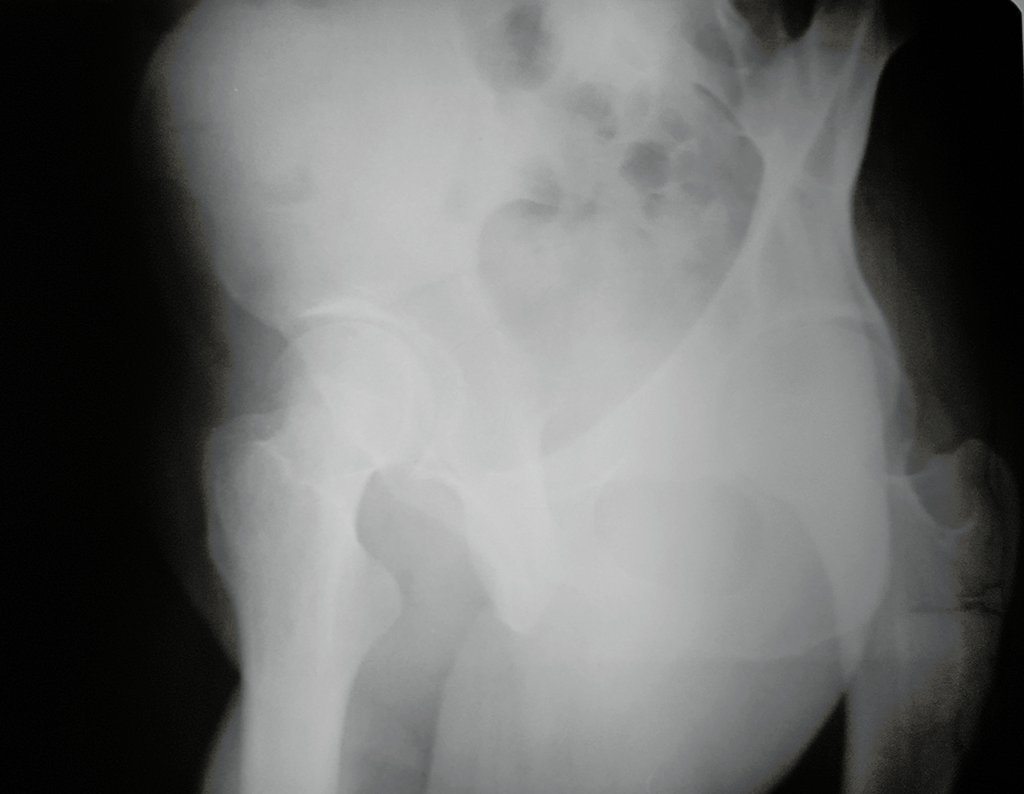
Figura 23: Radiografia da bacia, Lowenstein, realizada em 08/12/2016, para controle de infiltração articular.
Figure 23: X-ray of the pelvis, Lowenstein, carried out on 12/08/2016, to control joint infiltration.
Figura 24: Radiografia da bacia, alar, realizada em 08/12/2016, para controle de infiltração articular.
Figure 24: X-ray of the pelvis, alar, carried out on 12/08/2016, to control joint infiltration.
Figura 25: Laudo da ultrassonografia realizada em 08/12/2016, para orientação da infiltração articular.
Figure 25: Report of the ultrasound performed on 12/08/2016, to guide joint infiltration.
On January 23rd, he sought our evaluation when we confirmed the clinical and imaging diagnosis of osteoid osteoma, advised him to repeat the imaging exams and planned the excision of the tumor for the July holidays, for the patient’s convenience, as the pain was controlled. and there was no urgency for this benign lesion. The patient returns to his city of origin and undergoes imaging tests, as we had instructed, figures 26 to 30, which confirm the diagnosis of osteoid osteoma, already reported by this same laboratory in a previous exam, arrow in red and report highlighted in yellow .
Figura 26: Ressonância magnética de 25 de Janeiro de 2017, após dois anos do início da investigação, continua destacando a presença e a captação do nidus.
Figure 26: Magnetic resonance imaging on January 25, 2017, two years after the investigation began, continues to highlight the presence and capture of the nidus.
figura 27: Tomografia de 25/01/2017 evidenciando a mesma lesão, já detectada no exames anteriores desde 2015.
figure 27: Tomography from 01/25/2017 showing the same lesion, already detected in previous exams since 2015.
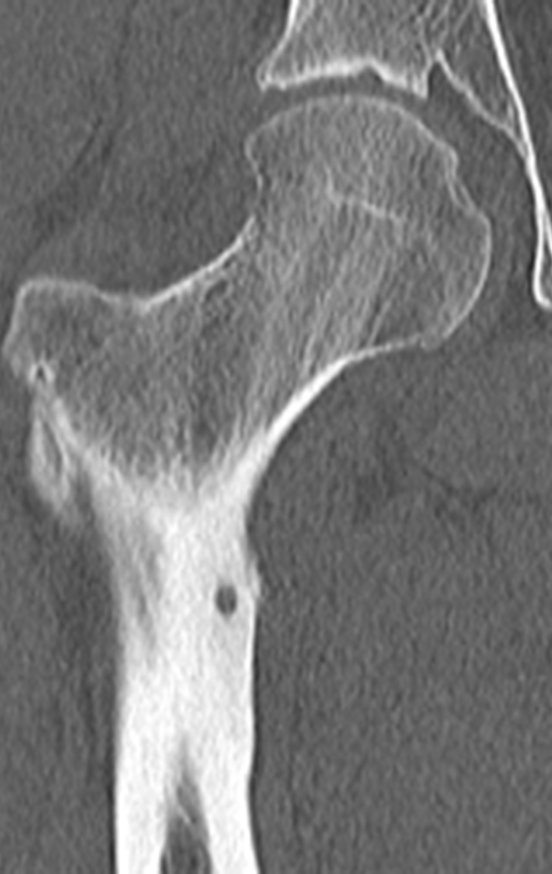
Figura 28: Tomografia coronal de janeiro de 2017 com presença de nidus na cotical femoral
Figure 28: Coronal tomography from January 2017 with presence of nidus in the femoral cotical
Figura 29: Tomografia com reconstrução 3D de janeiro de 2017 com presença de esclerose óssea saliente na cotical femoral antero medial.
Figure 29: Tomography with 3D reconstruction from January 2017 with the presence of prominent bone sclerosis in the anteromedial femoral ridge.
Figura 30: Laudo da tomografia de janeiro de 2017 reafirmando a presença com presença da lesão, já referida anteriormente.
Figure 30: CT report from January 2017 reaffirming the presence of the lesion, as previously mentioned.
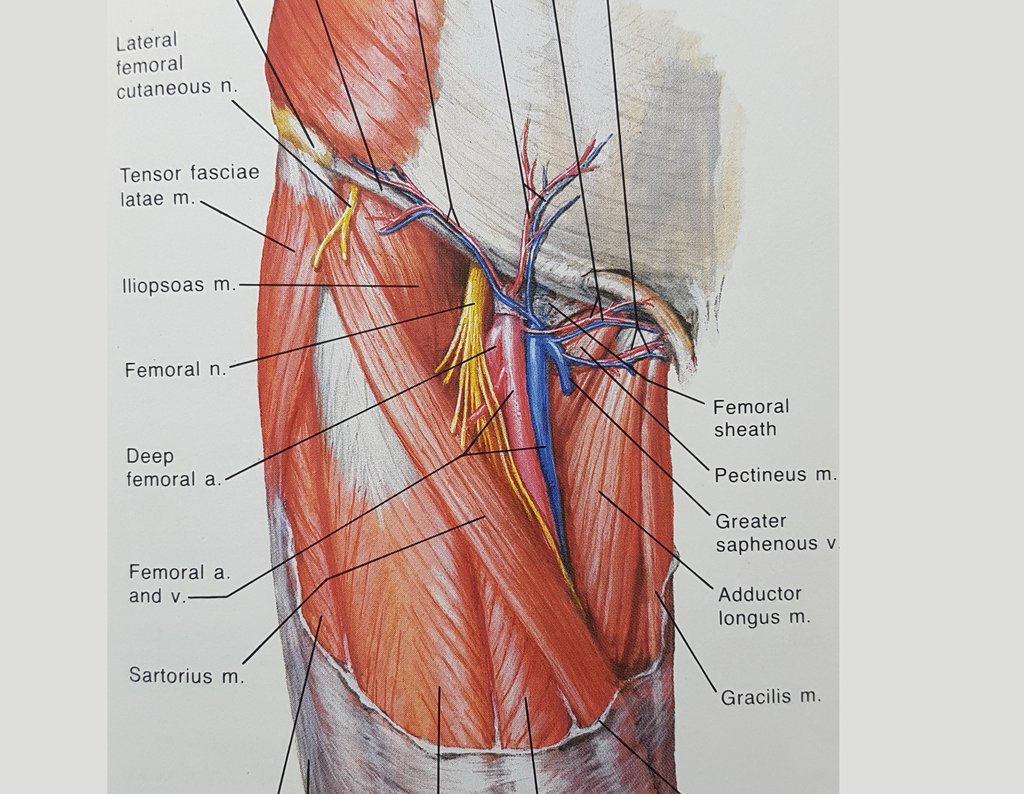
To plan this surgery, we reviewed the local anatomy, observing that the lesion was located in the intertrochanteric region, on the anterior surface of the femoral cortex, figures 31 and 32.
Figura 31: Anatomia da região proximal anterior da coxa, exibindo a musculatura envolvida no acesso cirúrgico.
Figure 31: Anatomy of the anterior proximal region of the thigh, showing the muscles involved in the surgical access.
Figura 32: Detalhamento dos vasos e nervos envolvidos para a abordagem na ressecção da lesão.
Figure 32: Detail of the vessels and nerves involved in the approach to resection of the lesion.
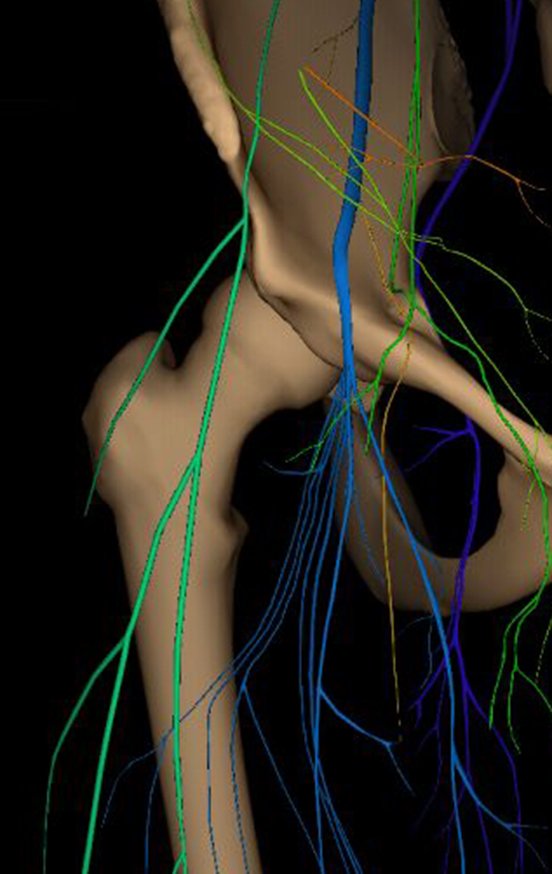
In another anatomical study, we can recall the muscles of this region and the extracapsular relationship of the lesion (figure 33), as well as their situation under the descending branch of the lateral femorocutaneous nerve and under the transverse branch of the anterior circumflex artery, white arrow, figures 34 and 35. To safely resect the tumor niche, and avoid the need to place an autologous bone graft, we planned to use intraoperative gammagraphy, figure 36.
Figura 33: Anatomia músculo-esquelética da região da lesão, seta amarela.
Figure 33: Musculoskeletal anatomy of the injured region, yellow arrow.
Figura 34: Anatomia vascular (em azul) e nervosa (em verde) da topografia da localização da lesão
Figure 34: Vascular (in blue) and nervous (in green) anatomy of the topography of the lesion location
Figura 35: Ramo transverso da artéria circunflexa anterior, em branco, passando por cima da lesão.
Figure 35: Transverse branch of the anterior circumflex artery, in white, passing over the lesion.
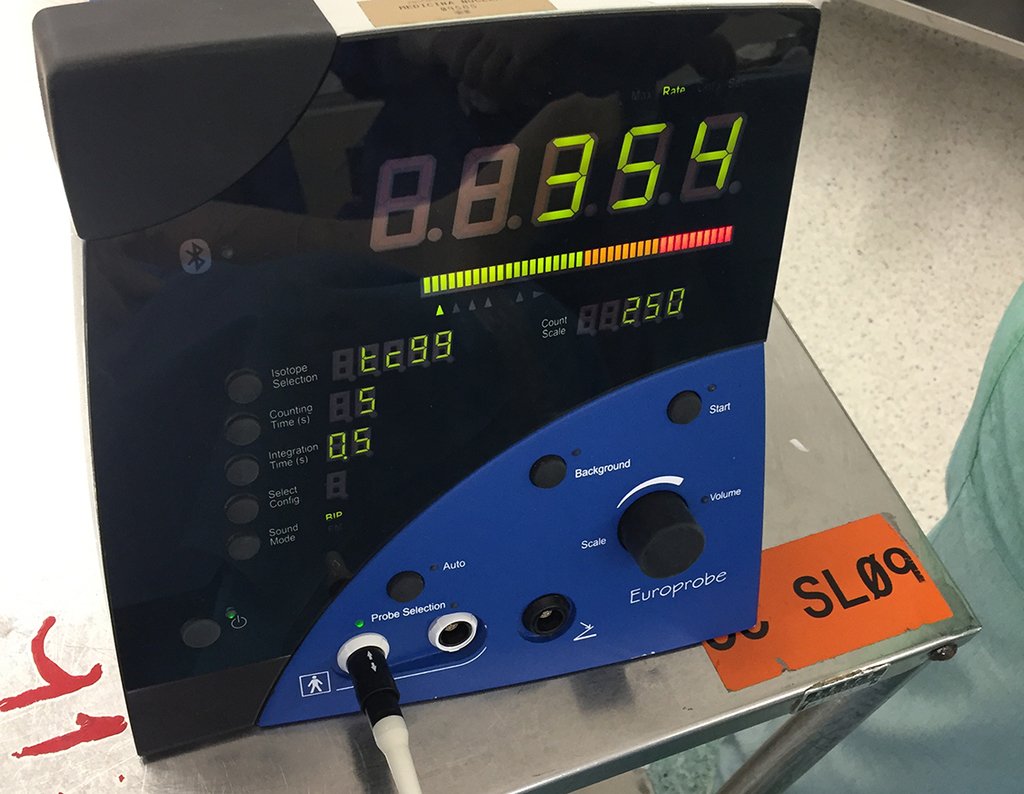
Figura 36: Marcação realizada na véspera da cirurgia, após administração do tecnécio, no ponto de maior captação detectado pelo probe.
Figure 36: Marking made the day before surgery, after administration of technetium, at the point of highest uptake detected by the probe.
The day before surgery, technetium was injected into the patient and the center with the highest uptake of the isotope was marked with gamma probo. The next day, with the patient anesthetized, we checked the marking and during surgery we confirmed the location and size of the surgical incision, figures 37 to 39.
Figura 37: Paciente antes da anestesia, detecção do local de maior captação do tecnécio.
Figure 37: Patient before anesthesia, detection of the site of greatest technetium uptake.
Figura 38: Paciente já anestesiado, confirmação do local de maior captação do tecnécio, planejamento para a realização da incisão cirúrgica.
Figure 38: Patient already anesthetized, confirmation of the site of greatest technetium uptake, planning for the surgical incision.
Figura 39: Incisão planejada bem em cima da lesão.
Figure 39: Incision planned right over the lesion.
We sought to identify, isolate with a microdissector and protect the descending branch of the lateral femorocutaneous nerve, figures 40 and 41.
Figura 40: Ramo descendente do nervo fêmuro cutâneo lateral, que se encontra sobre a lesão, seta em amarelo.
Figure 40: Descending branch of the lateral femoral cutaneous nerve, which lies over the lesion, yellow arrow.
Figura 41: liberação do ramo nervoso lateralmente, seta em amarelo.
Figure 41: release of the nerve branch laterally, yellow arrow.
After operative dissection and preparation for tumor excision. we checked the center of the lesion using the gamma probe, directly on the bone cortex, videos 1 and 2.
Video 1 : Intraoperative check of the point of greatest uptake.
Video 2: Measurement of the intensity of technetium uptake by the tumor.
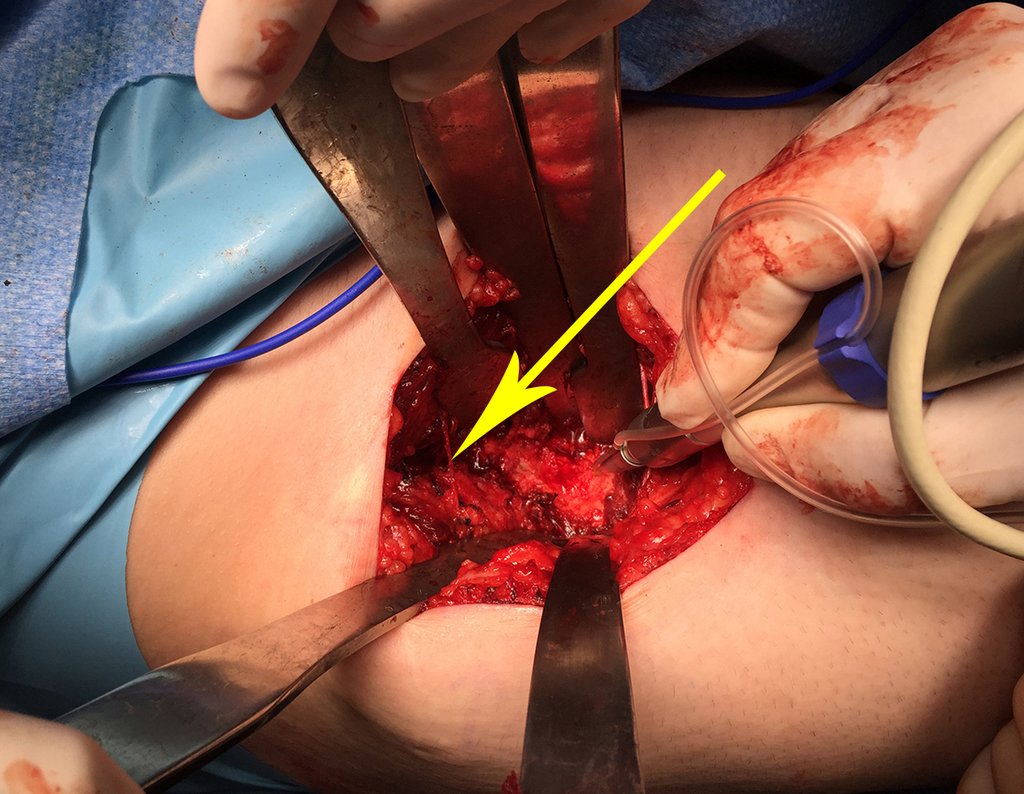
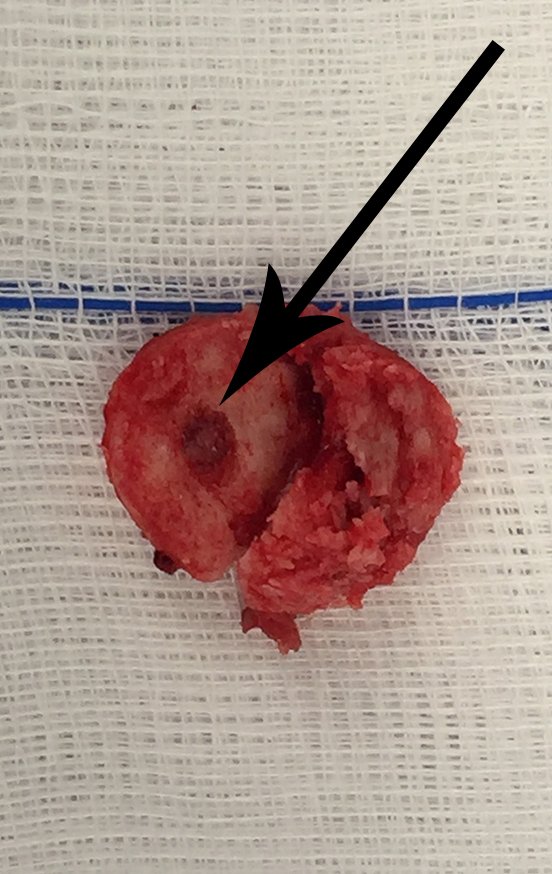
The yellow arrow highlights the nerve protected by the Hohmann retractor, the reading of the uptake peak and the circumferential cut of the cortex with a minimally invasive drill. We take care not to completely perforate the anterior cortex, avoiding weakening of the cortex and possible post-operative fracture, as well as eliminating the need for an autologous bone graft, reducing surgical morbidity. We resected the lesion, with a small circumferential margin of bone sclerosis, figures 42 to 46.
Figura 42: Ramo nervoso liberado e protegido por afastador de Homma, apoiado na cortical lateral da diáfise femoral. A seta assinal o nervo isolado.
Figure 42: Nerve branch released and protected by a Homma retractor, supported on the lateral cortex of the femoral diaphysis. The arrow marks the isolated nerve.
Figura 43: Detecção da intensidade máxima de captação, indicativo da proximidade do centro do tumor.
Figure 43: Detection of maximum uptake intensity, indicative of proximity to the center of the tumor.
Figura 44: Delimitação da periferia do tumor com aparelho surgic pró, utilizando brocas minimamente invasivas, irrigadas por soro fisiológico.
Figure 44: Delimitation of the periphery of the tumor with a surgical pro device, using minimally invasive drills, irrigated with saline solution.
Figura 45: Tumor já removido, observando-se a preservação da cortical interna da diáfise femoral, dispensando a necessidade de enxerto.
Figure 45: Tumor already removed, observing the preservation of the internal cortex of the femoral diaphysis, eliminating the need for a graft.
Figura 46: Peça ressecada, observando-se a boa margem ao redor e o nicho central do tumor, destacado pela seta preta.
Figure 46: Resected piece, observing the good margin around it and the central niche of the tumor, highlighted by the black arrow.
With the resected segment, placed in a vat, we checked the presence of the lesion through gamma probe capture, video 3.
Video 3 : After resection, the intensity of uptake in the resected piece is checked.
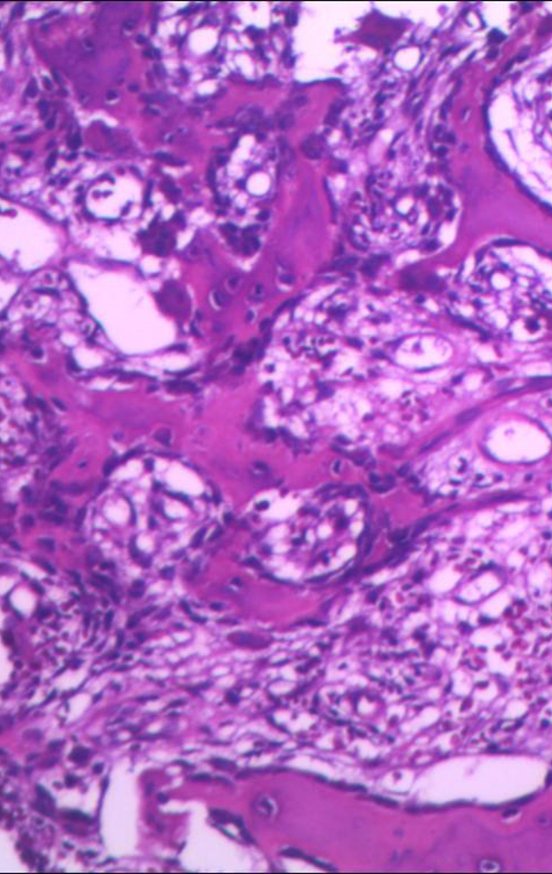
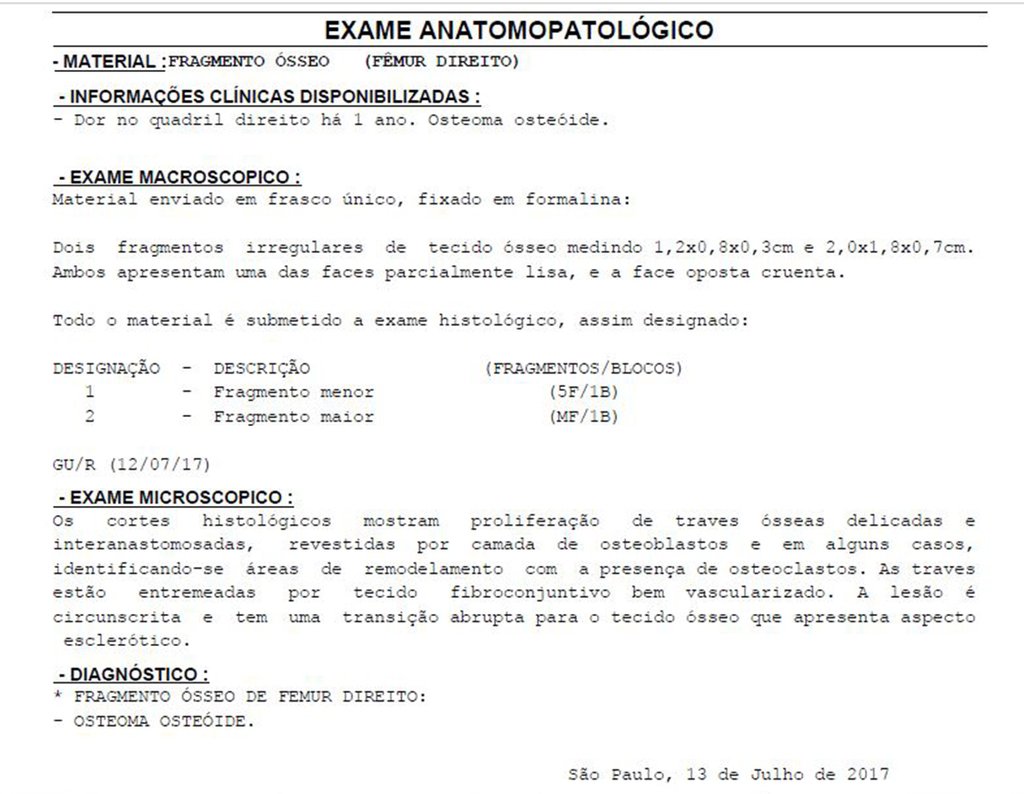
The anatomopathological study of the piece confirmed that it was an osteoid osteoma, figures 47 to 51.
Figura 47: Histologia em hematoxilia e eosina com tecido osteóide e osteoblastos maduros, envolvidos por halo de esclerose óssea.
Figure 47: Histology in hematoxylia and eosin with osteoid tissue and mature osteoblasts, surrounded by a halo of bone sclerosis.
Figura 48: Histologia característica de osteoma osteóide.
Figure 48: Characteristic histology of osteoid osteoma.
Figura 49: Histologia de tecido ósseo maduro e osteóide.
Figure 49: Histology of mature bone and osteoid tissue.
Figura 50: Histologia de tecido ósseo maduro e osteóide neoformado, sem atipias.
Figure 50: Histology of mature bone tissue and newly formed osteoid, without atypia.
Figura 51: Laudo anátomo patológico confirmando o diagnóstico de osteoma osteóide.
Figure 51: Pathological anatomical report confirming the diagnosis of osteoid osteoma.

Author: Prof. Dr. Pedro Péricles Ribeiro Baptista

 Orthopedic Oncosurgery at the Dr. Arnaldo Vieira de Carvalho Cancer Institute

Hello! How can we assist you?