This digital library houses the book on Oncology and Orthopedic Oncosurgery.

It includes academic lectures, presentations from national and international congresses, published papers, case discussions, performed surgical procedures, and proprietary techniques developed.

The digital format was chosen because the web allows the inclusion of texts with numerous visual resources, such as images and videos, which would not be possible in a printed book.

The content is intended for students, healthcare professionals, and the general public interested in the field.

Epiphysiodesis technique and rotating partial prosthesis

Bd9b0b4fe7c7d2f2c932c8d279ddb529 3
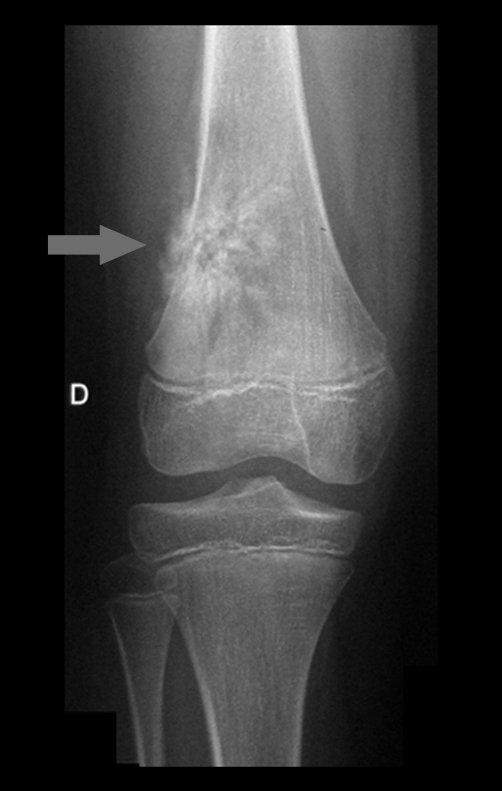
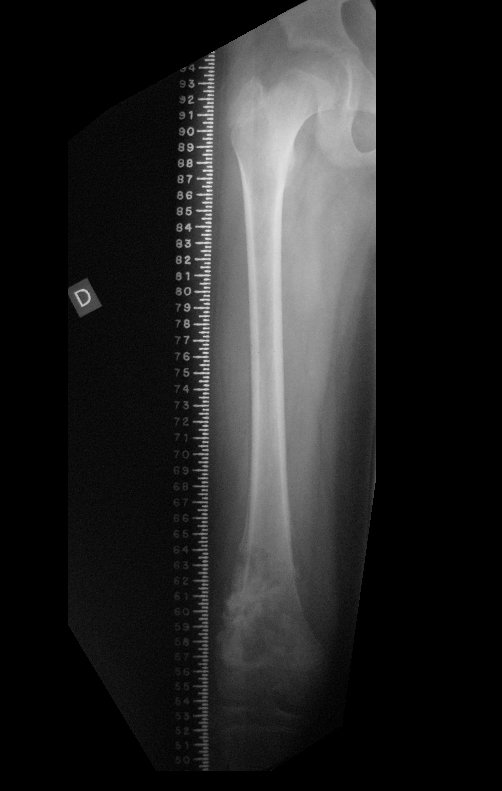
Epiphysiodesis technique and rotating partial prosthesis. 11-year-old patient, presenting with knee pain and increased volume in the lower third of the right femur. X-rays from February 2014 showed a lesion producing bone tissue in the metaphysis, figures 1 and 2. The scintigraphy revealed that it was a single lesion with intense uptake in the distal metaphyseal region of the femur, figures 3 and 4.

Epiphysiodesis technique and rotating partial prosthesis, with preservation of the tibial growth physis, in osteosarcoma of the femur.

Figura 1: Radiografia do 1/3 distal do fêmur direito, com lesão de condensação óssea de limites imprecisos e triângulo de Codman com reação periosteal em raios de sol.
Figure 1: Radiograph of the distal 1/3 of the right femur, with bone condensation lesion with imprecise limits and Codman's triangle with periosteal reaction in sunlight.
Figura 2: Na radiografia em perfil, observa-se a área de condensação irregular, e a expansão tumoral extracortical na face anterior. Triangulo de Codman e reação periosteal lamelar fina.
Figure 2: On the lateral x-ray, the area of ​​irregular condensation and extracortical tumor expansion on the anterior surface are observed. Codman's triangle and thin lamellar periosteal reaction.
Figura 3: Cintilografia óssea, fase tardia, vista anterior e posterior, com intensa captação na região metafisária distal do fêmur direito.
Figure 3: Bone scintigraphy, late phase, anterior and posterior view, with intense uptake in the distal metaphyseal region of the right femur.
Figura 4 : Cintilografia ampliada evidenciando hipercaptação no fêmur direito.
Figure 4: Magnified scintigraphy showing high uptake in the right femur.
To expand the study of the lesion, a Pet-Ct examination was performed, figures 5 to 8.
Figura 5: Pet-Ct realizado em fevereiro de 2014 com captação na região metafisária distal do fêmur direito, junto à placa de crescimento.
Figure 5: Pet-Ct performed in February 2014 with capture in the distal metaphyseal region of the right femur, next to the growth plate.
Figura 6: Hipercaptação na metáfise distal do fêmur direito.
Figure 6: Hyperuptake in the distal metaphysis of the right femur.
Figura 7: Alta concentração de contraste no fêmur direito.
Figure 7: High contrast concentration in the right femur.
Figura 8: Laudo do Spect-Ct de 26/02/2014.
Figure 8: Spect-Ct report of 02/26/2014.
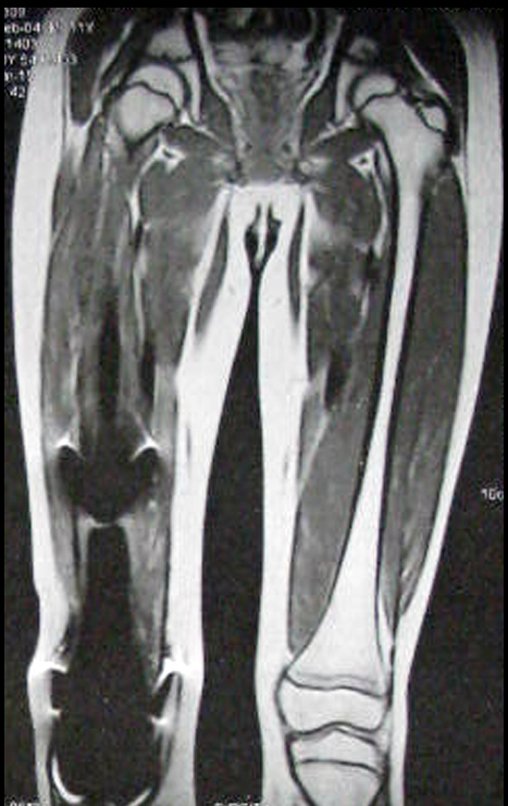
Continuing the staging, magnetic resonance imaging was performed, figures 9 to 18.
Figura 9: RM coronal T1, com lesão de alto e baixo sinal, com limites imprecisos.
Figure 9: Coronal T1 MRI, with high and low signal lesions, with imprecise limits.
Figura 10: RM sagital T1 com lesão de baixo sinal, ocupando a metáfise femoral e lesão extracortical anterior e posterior no fêmur.
Figure 10: Sagittal T1 MRI with low signal lesion, occupying the femoral metaphysis and anterior and posterior extracortical lesion in the femur.
Figura 11: RM sagital T1 com supressão de gordura, lesão de alto e baixo sinal, heterogênea e grande lesão extracortical anterior e posterior no fêmur.
Figure 11: Sagittal T1 MRI with fat suppression, high and low signal, heterogeneous lesion and large anterior and posterior extracortical lesion in the femur.
Figura 12: RM sagital T1, supressão de gordura, com intensa captação de contraste.
Figure 12: Sagittal T1 MRI, fat suppression, with intense contrast uptake.
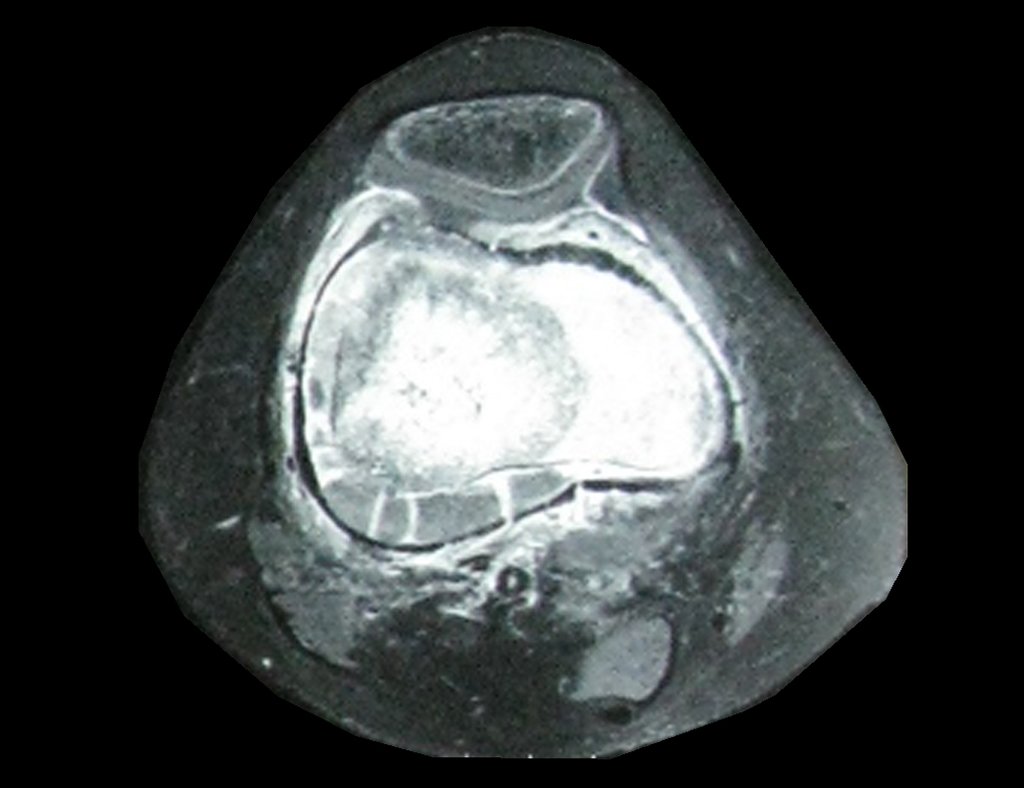
Figura 13: RM axial fat T1, lesão metafisária e tumor extracortical.
Figure 13: Axial fat T1 MRI, metaphyseal lesion and extracortical tumor.
Figura 14: RM axial fat T1, corte mais proximal, lesão metafisária e grande tumor extracortical, delimitado externamente pelo periósteo que foi descolado da cortical.
Figure 14: Axial fat T1 MRI, most proximal section, metaphyseal lesion and large extracortical tumor, externally delimited by the periosteum that was detached from the cortex.
Figura 15: RM axial fat T1, com intensa captação de gadolínio.
Figure 15: Fat T1 axial MRI, with intense gadolinium uptake.
Figura 16: RM axial fat T1, com intensa captação de gadolínio, corte mais proximal.
Figure 16: Fat T1 axial MRI, with intense gadolinium uptake, more proximal section.
Figura 17: RM axial fat T1, com intensa captação de gadolínio. A seta aponta o periósteo deslocado e crescimento de tumor entre o periósteo e a cortical.
Figure 17: Axial fat T1 MRI, with intense gadolinium uptake. The arrow points to the displaced periosteum and tumor growth between the periosteum and the cortex.
Figura 18: Laudo da ressonância de 23/02/2014.
Figure 18: MRI report from 02/23/2014.
A puncture biopsy was performed, via a lateral approach, by another professional.
Figura 19: Face interna do terço distal da coxa direita.
Figure 19: Inner surface of the distal third of the right thigh.
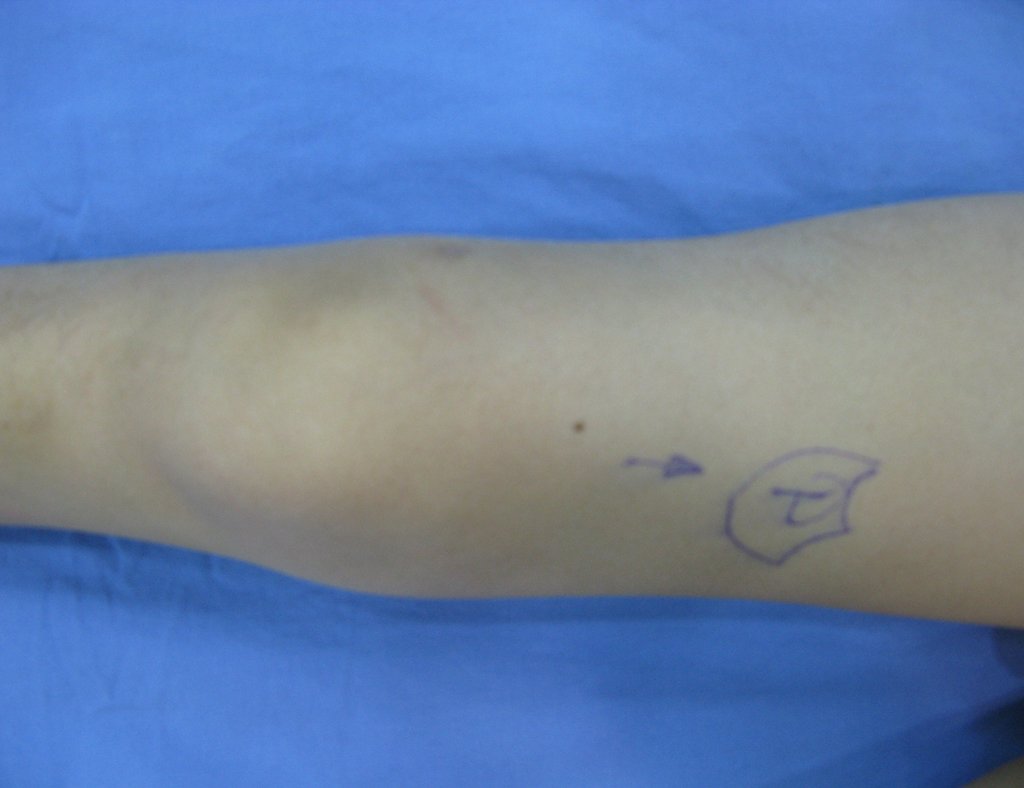
Figura 20: Face externa do joelho direito, com a cicatriz da biópsia.
Figure 20: External face of the right knee, with the biopsy scar.
Note that the biopsy site, figure 20, is much anterior, passing through the middle of the fascia lata, making future coverage of the surgery difficult, as the lower segment of the fascia would be sectioned both in the biopsy area, above, and at the edge below.
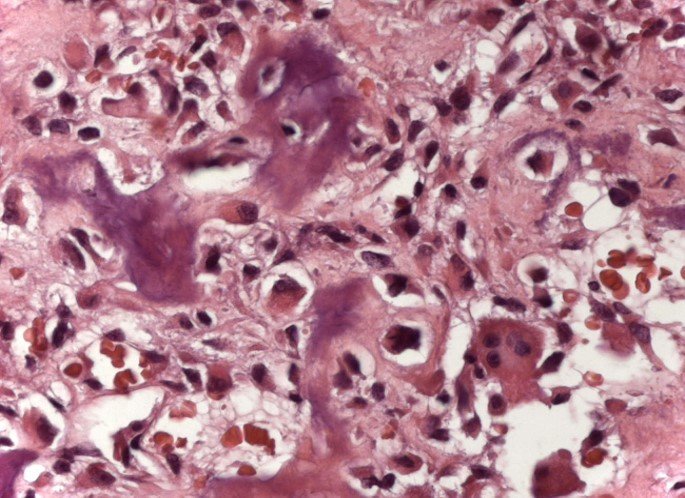
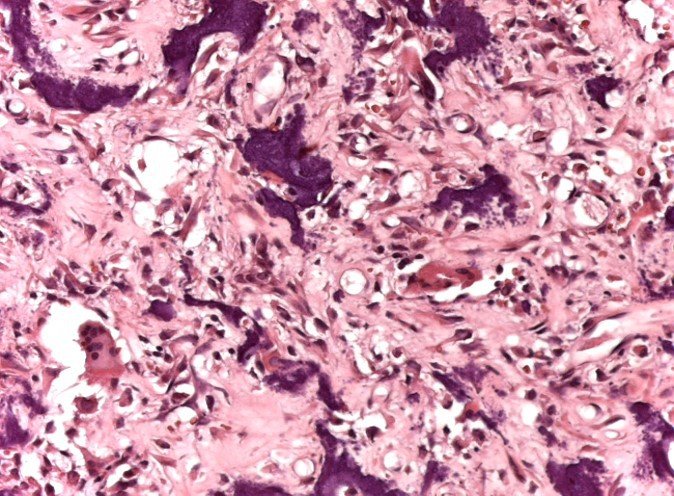
Figura 21: Histologia, osteossarcoma osteoblástico.
Figure 21: Histology, osteoblastic osteosarcoma.
Figura 22: Histologia, osteossarcoma osteoblástico.
Figure 22: Histology, osteoblastic osteosarcoma.
Figura 23: Laudo da biópsia.
Figure 23: Biopsy report.
Figura 24: Radiografia coronal, com régua para o desenho da endoprótese e planejamento da cirurgia.
Figure 24: Coronal radiograph, with ruler for designing the endoprosthesis and planning the surgery.
Figura 25: Radiografia sagital, com régua para o desenho da endoprótese e planejamento da cirurgia.
Figure 25: Sagittal radiograph, with ruler for designing the endoprosthesis and planning the surgery.
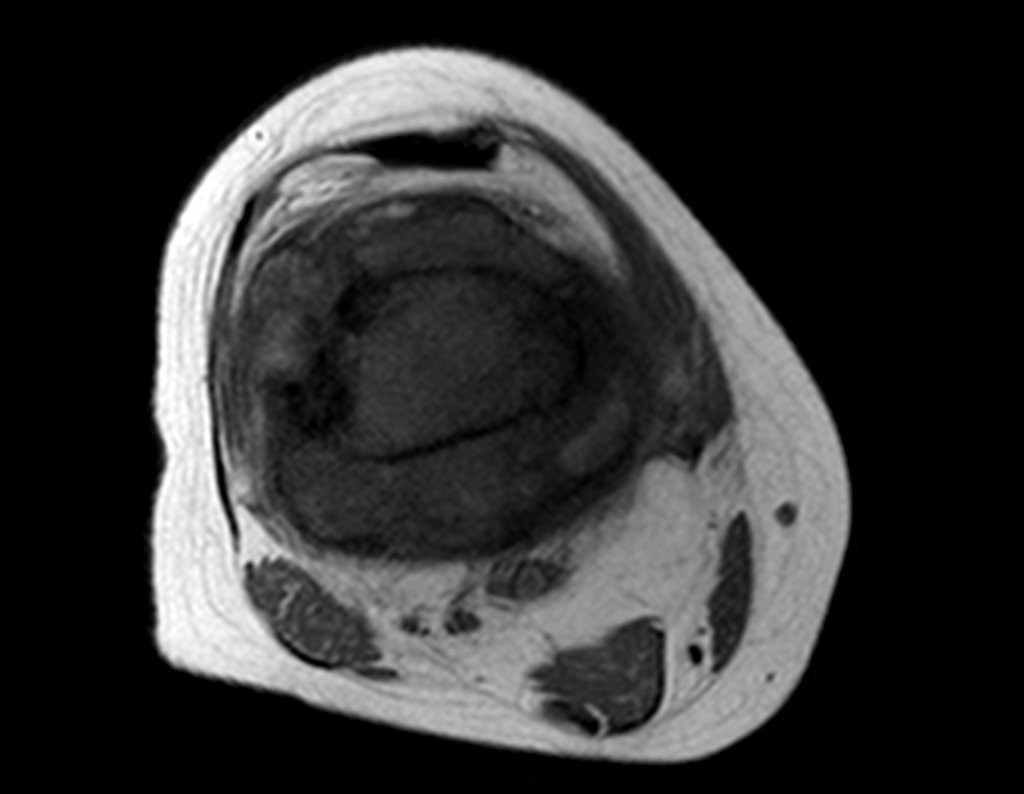
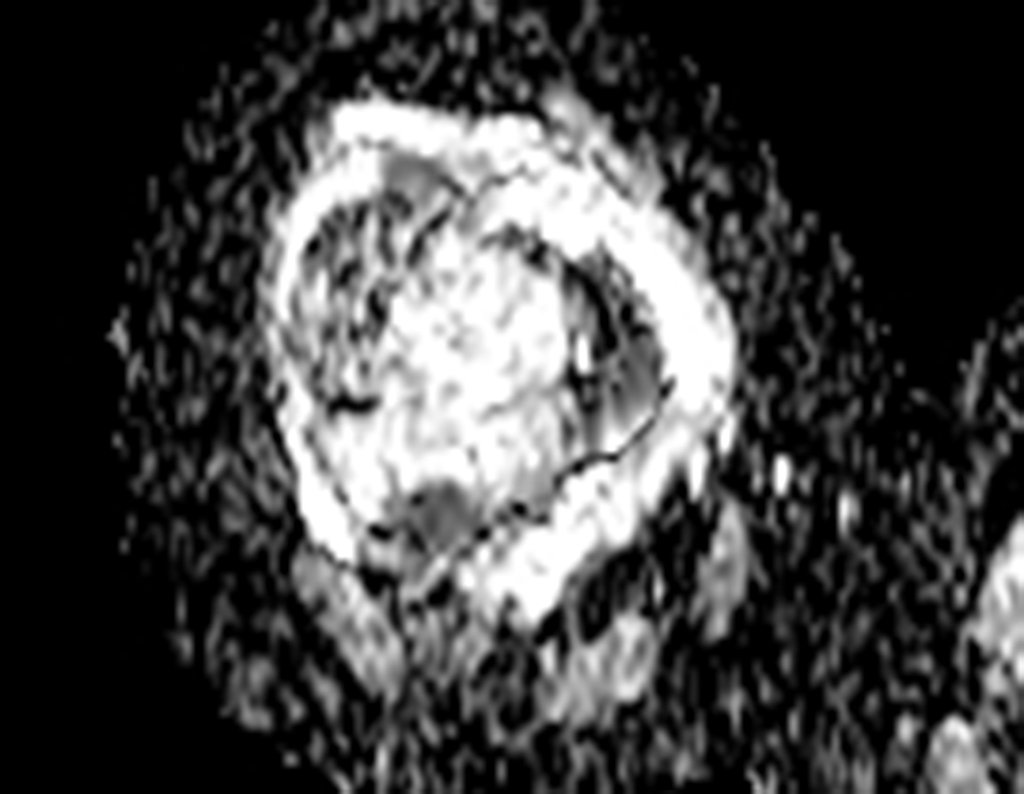
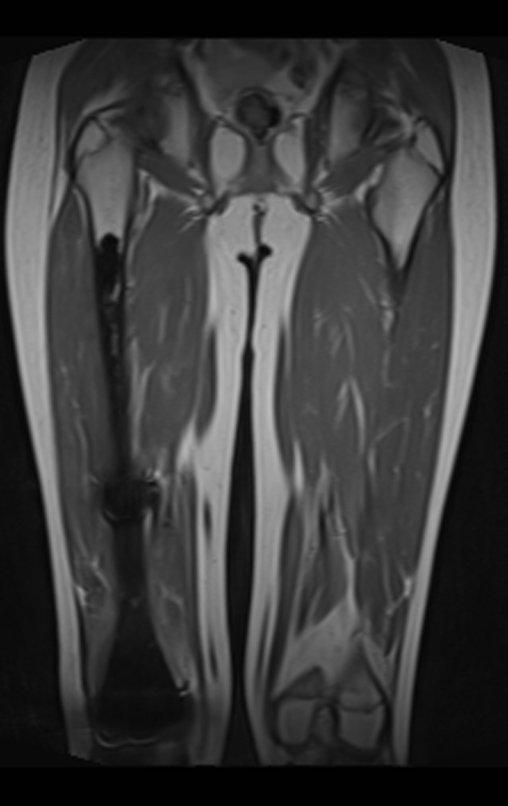
Before the last stage of neo-adjuvant chemotherapy, we take radiographs with a ruler of the segment to be resected, to plan the surgery and create a special prosthesis, when necessary, figures 23 and 24. In growing children, this procedure is generally necessary due to the different widths of the medullary canal, varying sizes of the femoral condyles, in addition to special devices that allow the growth potential of the epiphyseal plate to be preserved. At this stage we also perform a new MRI to image the evolution of the lesion, figures 26 to 41. It is rare, but the tumor may have increased during chemotherapy and will need to be resected with an oncological margin. However, the segment to be removed with margin can never be smaller than the size planned with the initial resonance, sized in the T1 view.
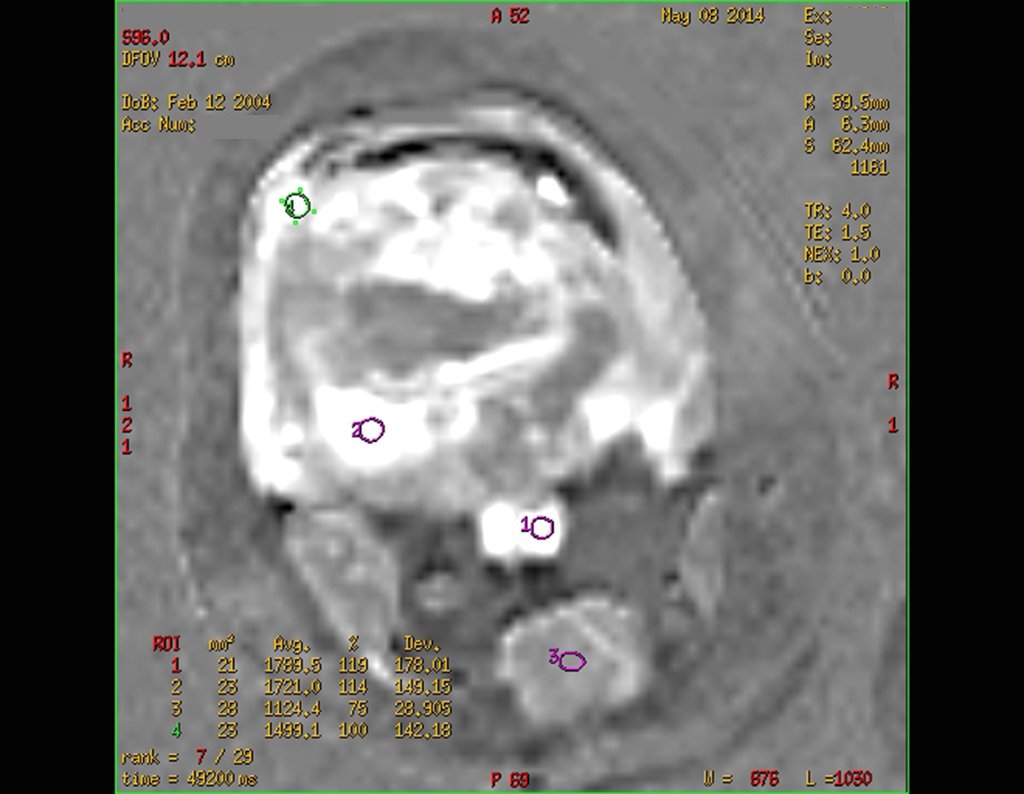
Figura 26: RM axial T1, pós quimioterapia de indução, mostrando condensação da lesão, que traduz boa resposta ao tratamento.
Figure 26: Axial T1 MRI, after induction chemotherapy, showing condensation of the lesion, which reflects a good response to treatment.
Figura 27: RM axial T1 - perfusão.
Figure 27: Axial T1 MRI - perfusion.
Figura 28: RM axial T1 - pós-contraste.
Figure 28: Axial T1 MRI - post-contrast.
Figura 29: RM axial T2.
Figure 29: Axial T2 MRI.
Figura 30: Difusão.
Figure 30: Diffusion.
Figura 31: Mapa, lesão tumoral.
Figure 31: Map, tumor lesion.
Figura 32: RM cor T1.
Figure 32: T1 color MRI.
Figura 33: RM cor-stir.
Figure 33: Cor-stir MRI.
Figura 34: RM sag-T1.
Figure 34: sag-T1 MRI.
Figura 35: RM sag-stir.
Figure 35: MR sag-stir.
Figura 36: RM sag-T2-fat.
Figure 36: sag-T2-fat MRI.
Figura 37: Screensaver.
Figure 37: Screensaver.
Figura 38: Screensaver-2.
Figure 38: Screensaver-2.
Figura 39: Screensaver-3.
Figure 39: Screensaver-3.
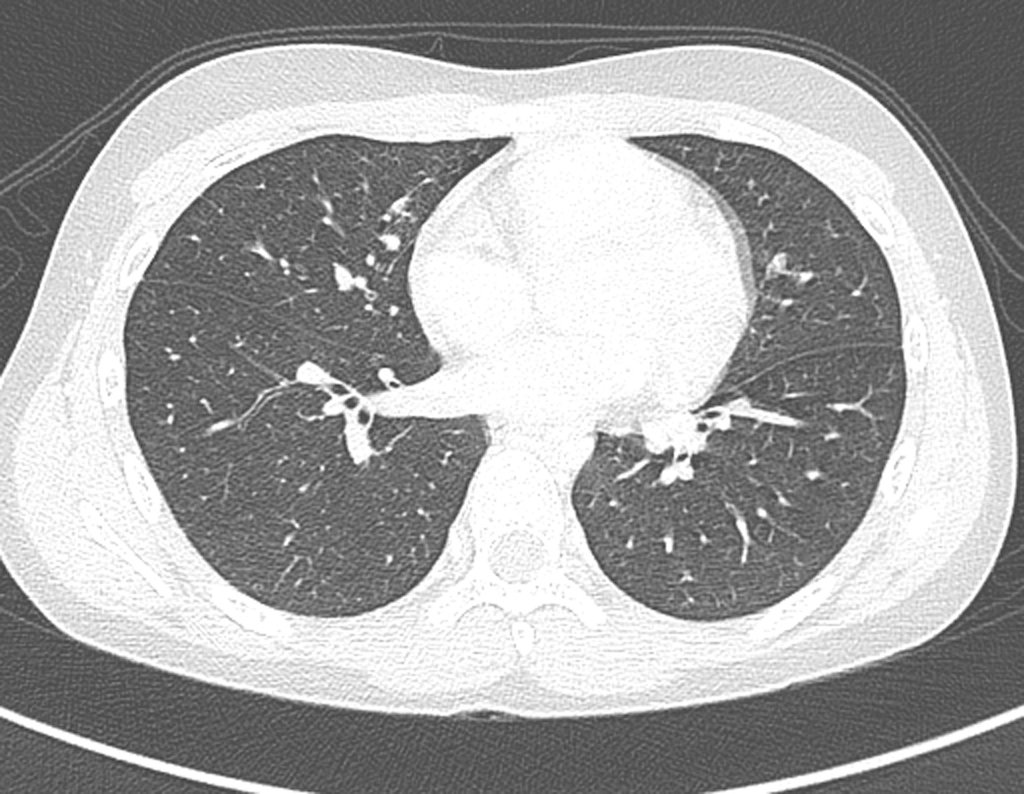
Figura 40: Tomografia de tórax de 25/02/2014, sem evidência de metástase.
Figure 40: Chest tomography on 02/25/2014, with no evidence of metastasis.
Figura 41: Tomografia de tórax de 25/02/2014, sem alteração.
Figure 41: Chest tomography on 02/25/2014, no changes.
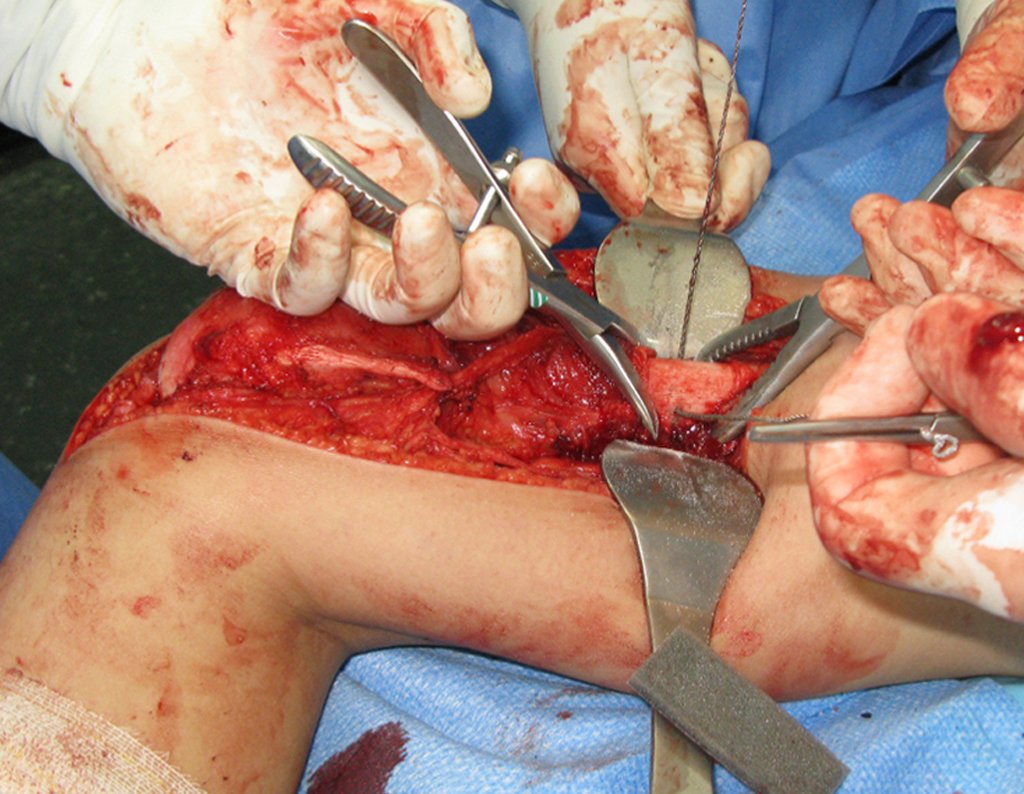
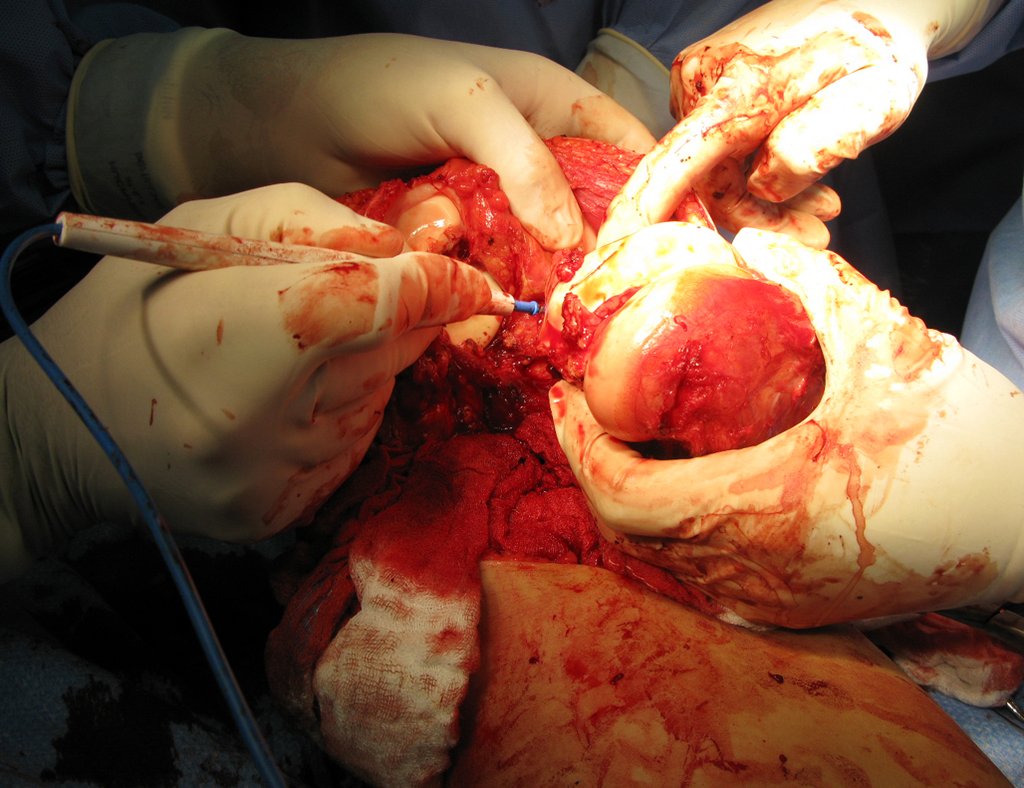
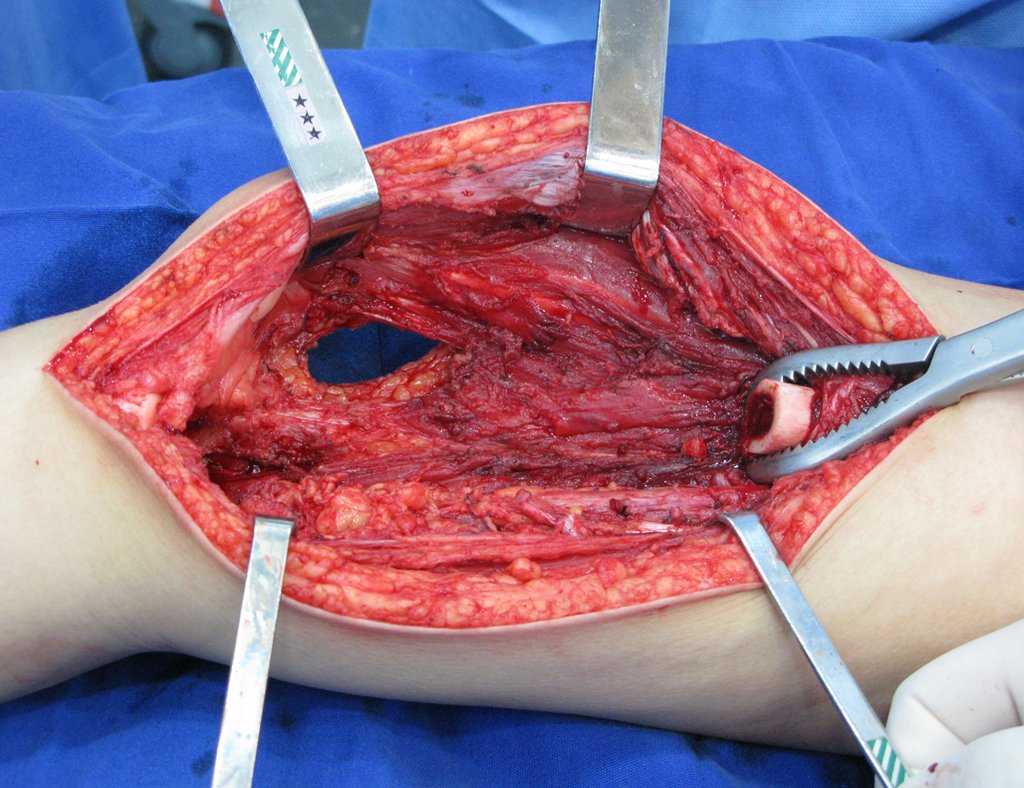
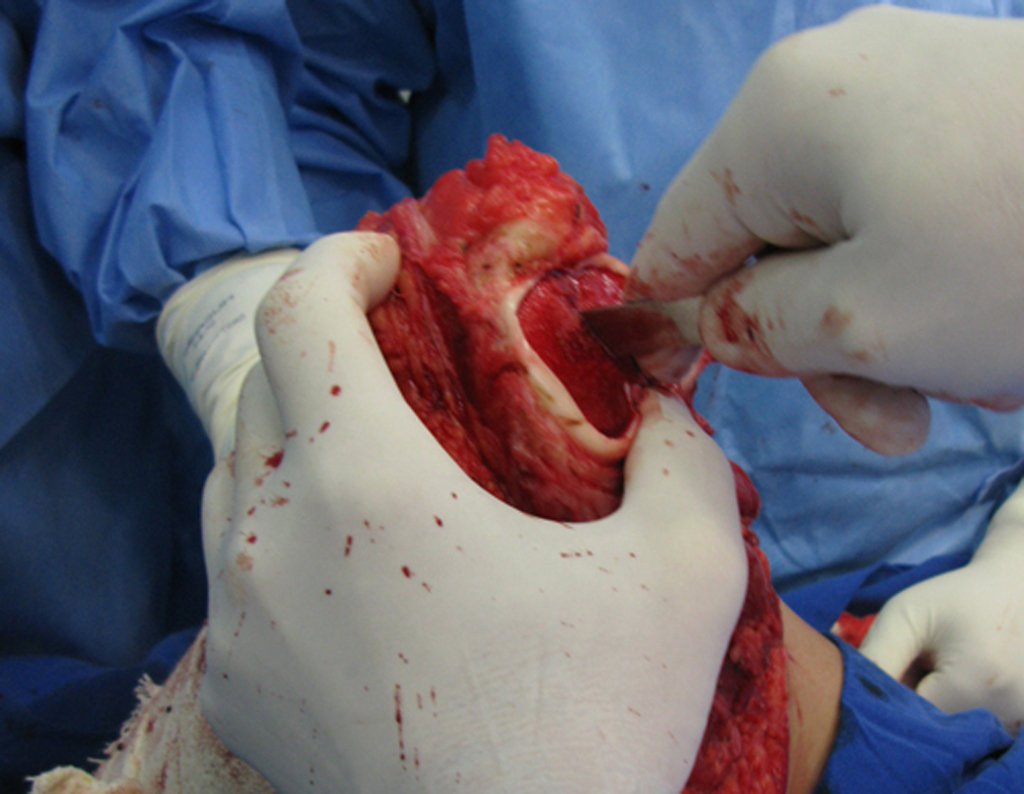
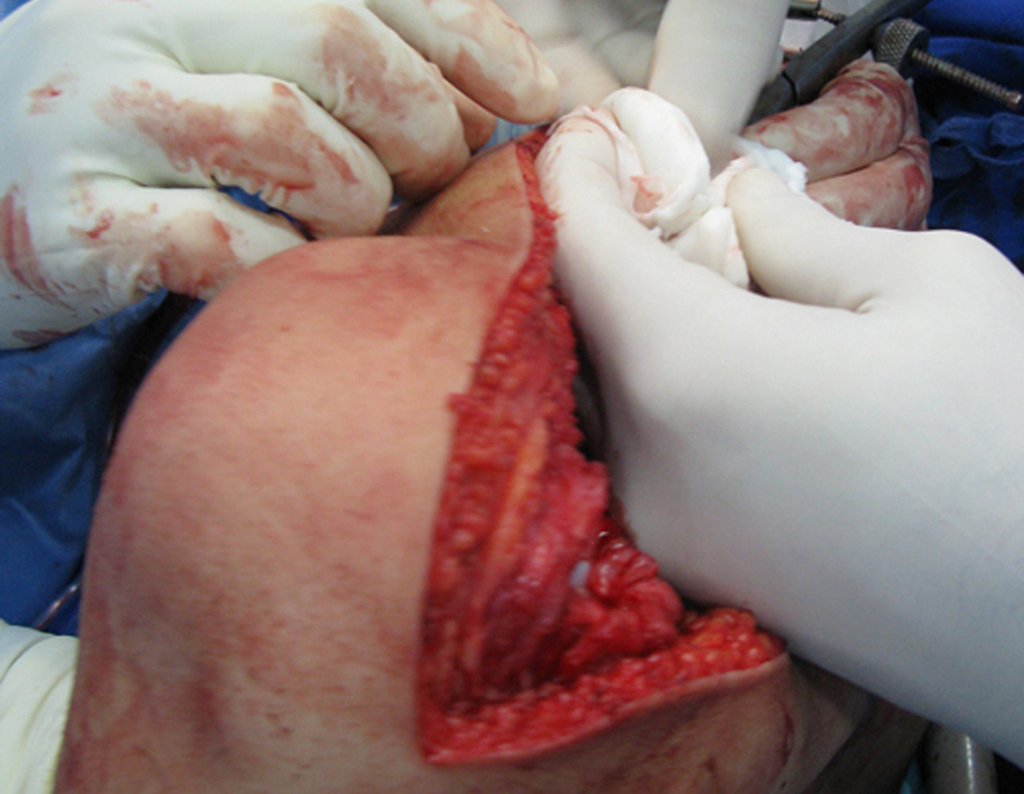
Tumor resection surgery was performed medially, removing the entire biopsy path and the lateral skin incision along with the surgical specimen. The surgical technique is explained in figures 42 to 98.
Figura 42: Aspecto da região comprometida pelo tumor após quimioterapia, pré-operatório.
Figure 42: Appearance of the region affected by the tumor after chemotherapy, pre-operatively.
Figura 43: Incisão cirúrgica por acesso medial ao fêmur, que permite uma melhor dissecção do feixe vascular.
Figure 43: Surgical incision through medial access to the femur, which allows better dissection of the vascular bundle.
The approach must be performed without tourniqueting the limb and with careful hemostasis, aiming to minimize blood loss in immunocompromised patients.
Figura 44: Abre-se a aponevrose medial na linha que delimita o contorno do músculo vasto medial, expondo o seu perimísio.
Figure 44: The medial aponeurosis opens along the line that delimits the contour of the vastus medialis muscle, exposing its perimysium.
Figura 45: Continua-se liberando esta aponevrose proximalmente, expondo-se o músculo sartório.
Figure 45: Continue releasing this aponeurosis proximally, exposing the sartorius muscle.
Figura 46: Realiza-se a hemostasia cuidadosamente e expõe-se o tendão do músculo adutor longo.
Figure 46: Hemostasis is carefully performed and the adductor longus muscle tendon is exposed.
Figura 47: Seccionamos o tendão do adutor longo e dissecamos o feixe vascular no canal de Hunter.
Figure 47: We sectioned the adductor longus tendon and dissected the vascular bundle in Hunter's canal.
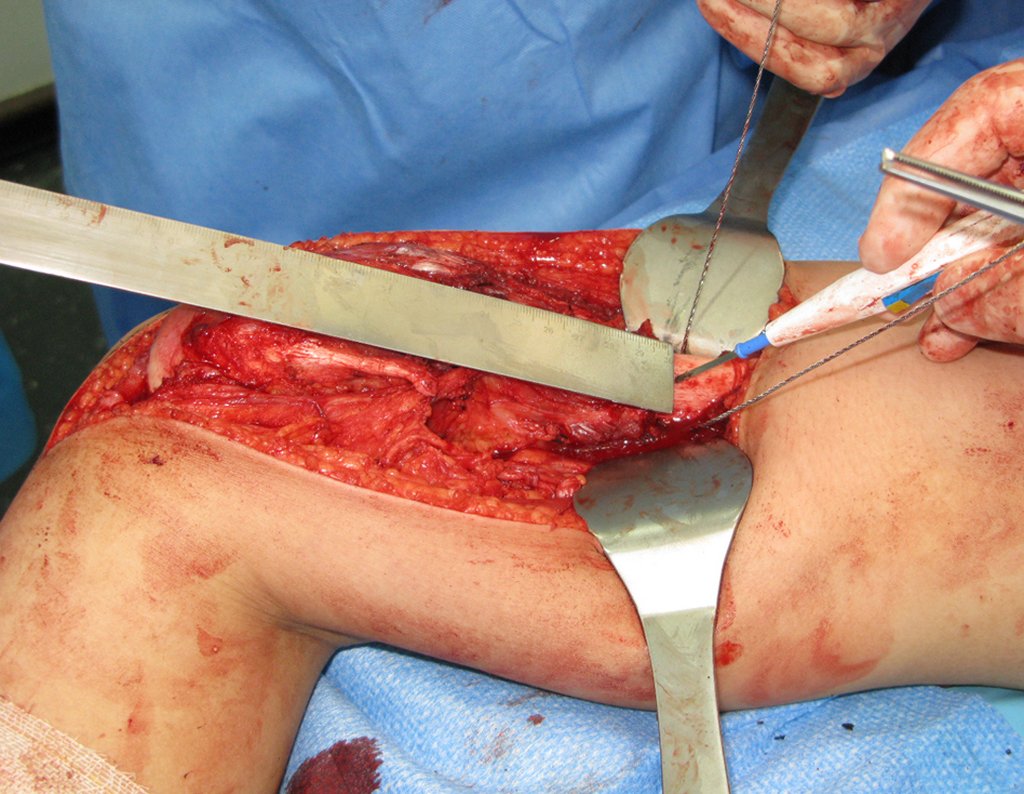
Figura 48: Mensuração do segmento a ser ressecado.
Figure 48: Measurement of the segment to be resected.
Figura 49: Osteotomia do fêmur com serra de Giglê.
Figure 49: Femoral osteotomy with a Giglê saw.
Figura 50: Osteotomia completada, os segmentos proximal e distal estão presos com pinças de osso.
Figure 50: Osteotomy completed, the proximal and distal segments are clamped with bone forceps.
Figura 51: Após a osteotomia, colhe-se amostra da medular óssea do segmento proximal, para estudo da margem oncológica.
Figure 51: After the osteotomy, a sample of the bone marrow from the proximal segment is taken to study the oncological margin.
Figura 52: Com a osteotomia realizada, prosseguimos com a dissecção do 1/3 distal do fêmur, liberando a cápsula posterior do joelho.
Figure 52: With the osteotomy performed, we proceeded with the dissection of the distal 1/3 of the femur, releasing the posterior capsule of the knee.
Figura 53: Liberação da porção lateral, e dissecção de todo o trajeto da biópsia em bloco com a peça cirúrgica.
Figure 53: Release of the lateral portion, and dissection of the entire biopsy path en bloc with the surgical specimen.
Figura 54: Ressecção em elipse da pele e tecido subcutâneo, contornando o trajeto da biópsia lateral, que é removido em bloco, com a peça cirúrgica.
Figure 54: Ellipse resection of the skin and subcutaneous tissue, bypassing the lateral biopsy path, which is removed en bloc, with the surgical specimen.
Figura 55: Secção lateral da fascia lata, subcutâneo e pele.
Figure 55: Lateral section of the fascia lata, subcutaneous tissue and skin.
Figura 56: Dissecção da fascia lata, em sua porção inferior, completando a retirada do trajeto da biópsia em bloco.
Figure 56: Dissection of the fascia lata, in its lower portion, completing the removal of the en bloc biopsy path.
Figura 57: Campo cirúrgico após a ressecção do 1/3 distal do fêmur, contendo o tumor e o trajeto da biópsia ressecado em bloco, com margem oncológica no osso e em tecidos moles.
Figure 57: Surgical field after resection of the distal 1/3 of the femur, containing the tumor and the biopsy path resected en bloc, with an oncological margin in the bone and soft tissues.
Figura 58: Visão antero lateral da peça cirúrgica, com a pele e o trajeto da biópsia, ressecados em bloco.
Figure 58: Anterolateral view of the surgical specimen, with the skin and the biopsy path, resected en bloc.
Figura 59: Visão posterior da peça cirúrgica, com tecidos moles sadios recobrindo o tumor.
Figure 59: Posterior view of the surgical specimen, with healthy soft tissue covering the tumor.
Figura 60: Fresagem e alargamento do canal femoral.
Figure 60: Milling and widening of the femoral canal.
Figura 61: Montagem e teste da prótese de prova.
Figure 61: Assembly and testing of the trial prosthesis.
Figura 62: Regularização circunferencial da ressecção meniscal.
Figure 62: Circumferential regularization of meniscal resection.
Figura 63: Platô tibial liberado e exposto para retirada da cartilagem articular da tíbia.
Figure 63: Tibial plateau released and exposed for removal of the tibial articular cartilage.
Figura 64: Cuidadosamente com formão, inicia-se a retirada parcial da porção central da cartilagem da tíbia.
Figure 64: Carefully using a chisel, begin to partially remove the central portion of the tibial cartilage.
Figura 65: Com um bisturi de lâmina 15 e o molde da prótese delineamos o contorno da cartilagem a ser removida.
Figure 65: Using a 15 blade scalpel and the prosthesis mold, we outline the contour of the cartilage to be removed.
Figura 66: O platô da tíbia está preparado com uma borda circunferencial de cartilagem articular da tíbia, para conter o cimento e fixar melhor o componente tibial.
Figure 66: The tibial plateau is prepared with a circumferential border of tibial articular cartilage, to contain the cement and better fix the tibial component.
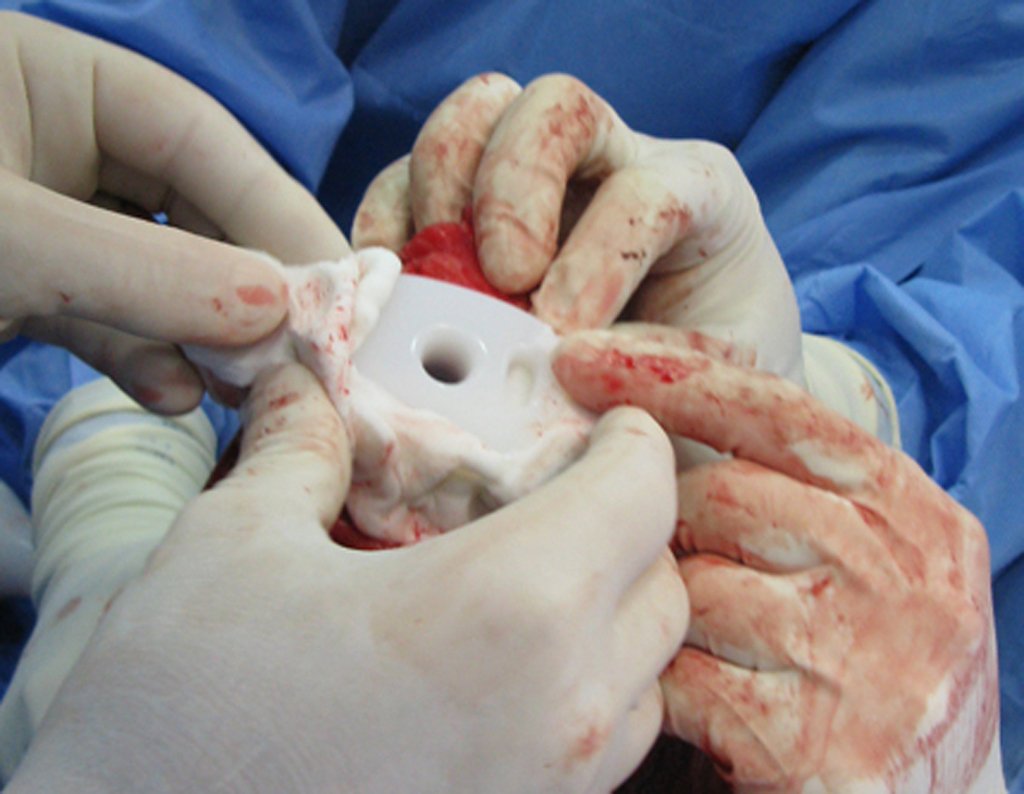
Figura 67: Com o auxílio de osteótomo, realizamos uma fenda retangular no centro do platô tibial.
Figure 67: With the help of an osteotome, we made a rectangular slit in the center of the tibial plateau.
Figura 68: Fenda central preparada.
Figure 68: Prepared central crack.
Figura 69: Realização de um orifício central, com uma fresa fina, que vai ultrapassar a cartilagem de crescimento. Deve-se ter muita cautela nesta etapa para não traumatizar a fise, evitando-se a formação de barra óssea. .
Figure 69: Making a central hole, with a fine drill, which will go beyond the growth cartilage. Great care must be taken at this stage to avoid traumatizing the physis, avoiding the formation of bone bars. .
Figura 70: Alargamento cauteloso do canal tibial, para acomodar o componente tibial.
Figure 70: Cautious widening of the tibial canal to accommodate the tibial component.
Figura 71: Teste de acomodação do componente tibial rotatório.
Figure 71: Rotational tibial component accommodation test.
Figura 72: Colocação de cimento no platô tibial e fixação da prótese. Não se coloca cimento no canal femoral.
Figure 72: Placement of cement on the tibial plateau and fixation of the prosthesis. No cement is placed in the femoral canal.
Figura 73: Cimentação circunferencial do platô da tíbia e do componente tibial da prótese.
Figure 73: Circumferential cementation of the tibial plateau and the tibial component of the prosthesis.
Figura 74: Modelagem e retirada do excesso de cimento.
Figure 74: Modeling and removal of excess cement.
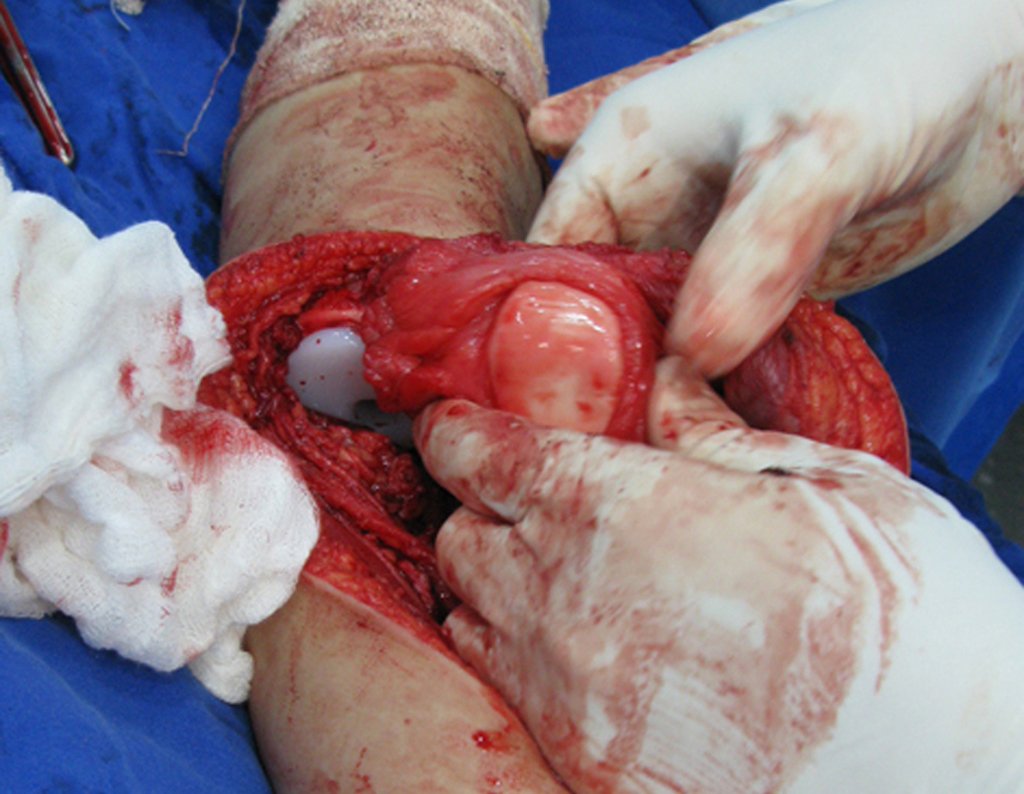
Figura 75: Posicionamento do componente femoral e ajuste da rotação.
Figure 75: Positioning of the femoral component and adjustment of rotation.
Figura 76: Compressão do componente tibial para melhor fixação da prótese ao cimento.
Figure 76: Compression of the tibial component for better fixation of the prosthesis to the cement.
Figura 77: Retirada do excesso de cimento, após a compressão.
Figure 77: Removal of excess cement after compression.
Figura 78: Manutenção da compressão do componente tibial até o final da secagem do cimento.
Figure 78: Maintaining compression of the tibial component until the end of the cement drying.
Figura 79: Colocação do componente femoral para teste de prova.
Figure 79: Placement of the femoral component for trial testing.
Figura 80: Com o joelho em flexão, alinha-se o membro tendo como parâmetro o segundo metatarso, e marca-se o posicionamento rotacional do componente femoral.
Figure 80: With the knee in flexion, the limb is aligned using the second metatarsal as a parameter, and the rotational positioning of the femoral component is marked.
Figura 81: Expõe-se a patela.
Figure 81: The patella is exposed.
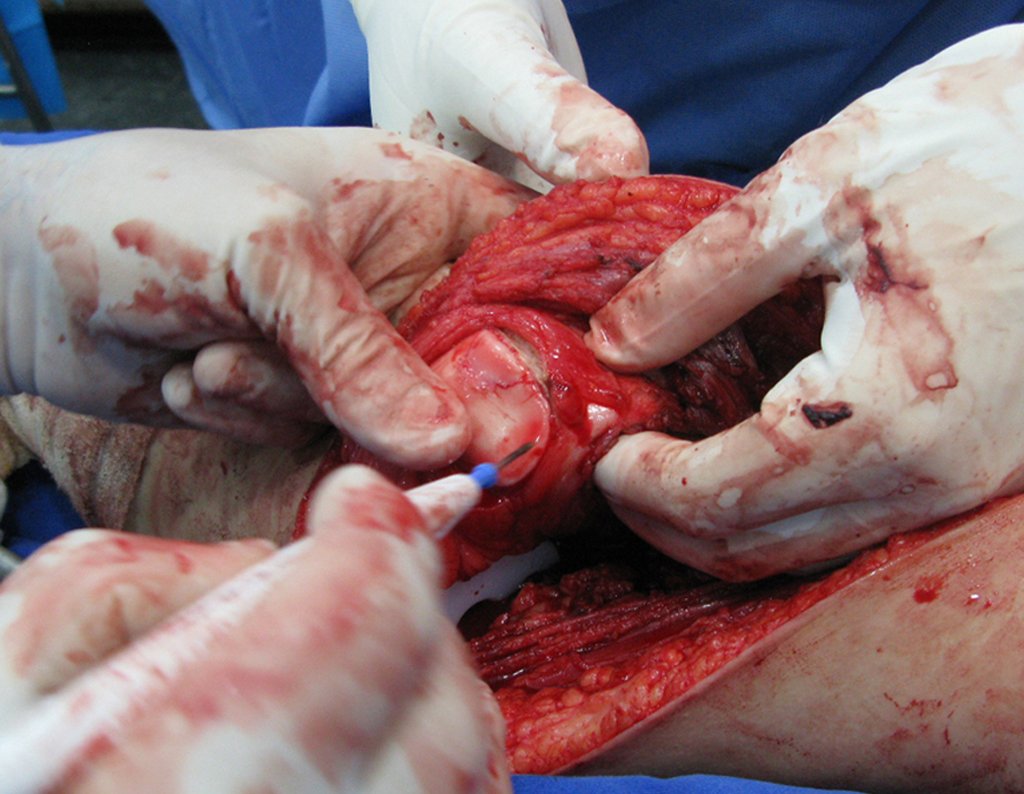
Figura 82: Regulariza-se o polo superior para melhorar a acomodação no sulco patelar da prótese. É preferível o formão, à serra vibratória nesta etapa, para não ferir a cartilagem patelar remanescente.
Figure 82: The upper pole is adjusted to improve accommodation in the patellar groove of the prosthesis. A chisel is preferable to a vibrating saw at this stage, so as not to injure the remaining patellar cartilage.
Figura 83: Liberação do ápice patelar.
Figure 83: Release of the patellar apex.
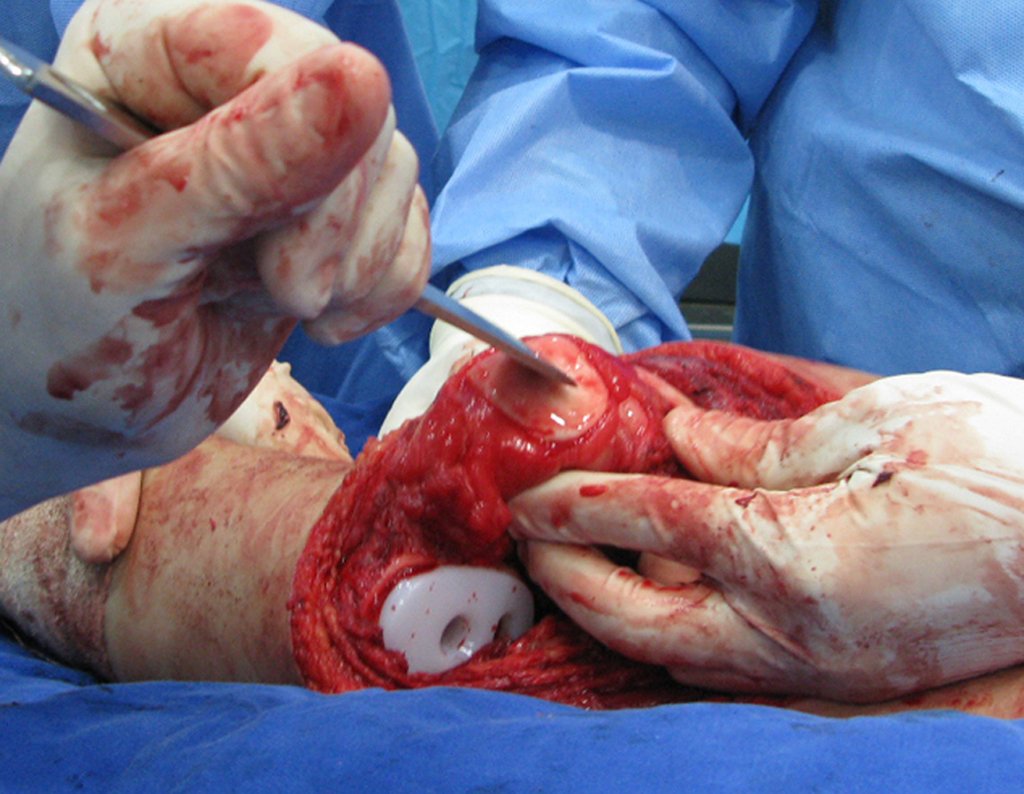
Figura 84: Liberação circunferencial da patela, facilitando a acomodação ao sulco patelar.
Figure 84: Circumferential release of the patella, facilitating accommodation in the patellar groove.
Figura 85: Regularização do ápice da patela com serra vibratória, pois a osteotomia plana já foi realizada com formão.
Figure 85: Regularization of the apex of the patella with a vibrating saw, as the flat osteotomy was already performed with a chisel.
Figura 86: Preparação do canal medular femoral para cimentação.
Figure 86: Preparation of the femoral medullary canal for cementation.
Figura 87: Cimentação do canal medular femoral.
Figure 87: Cementation of the femoral medullary canal.
Figura 88: Fixação da prótese femoral com atenção ao controle rotacional.
Figure 88: Fixation of the femoral prosthesis with attention to rotational control.
Figura 89: Redução dos componentes femoral e tibial, e conferência do alinhamento em extensão.
Figure 89: Reduction of the femoral and tibial components, and checking alignment in extension.
Figura 90: Flexão do joelho e conferência do alinhamento e da rotação em flexão.
Figure 90: Knee flexion and checking alignment and rotation in flexion.
Figura 91: Posicionamento e alinhamento em flexão até a secagem completa do cimento.
Figure 91: Positioning and alignment in flexion until the cement dries completely.
Video 1: Free flexion and extension, without limitation.
Video 2: Placement of soft tissue hemostat.
Figura 92: Revisão da hemostasia.
Figure 92: Hemostasis review.
Figura 93: Colocação de hemostático de tecidos moles, completando a hemostasia.
Figure 93: Placement of soft tissue hemostat, completing hemostasis.
Figura 94: Reinserção do músculo vasto medial.
Figure 94: Reinsertion of the vastus medialis muscle.
Figura 95: Fechamento cuidadoso e reinserção da musculatura à prótese, para diminuir o espaço vazio e propiciar melhor função.
Figure 95: Careful closure and reinsertion of the muscles to the prosthesis, to reduce the empty space and provide better function.
Figura 96: Cobertura completa da prótese, preparo para sutura da aponevrose e subcutâneo.
Figure 96: Complete coverage of the prosthesis, preparation for suturing the aponeurosis and subcutaneous tissue.
Figura 97: Fechamento da incisão medial, e aproximação com micropore para diminuir a tensão e propiciar uma cicatrização mais cosmética.
Figure 97: Closing the medial incision, and approximation with micropore to reduce tension and provide more cosmetic healing.
Figura 98: Fixação do dreno aspirativo e sutura da incisão lateral, da exérese do trajeto da biópsia.
Figure 98: Fixation of the aspiration drain and suture of the lateral incision, excision of the biopsy path.
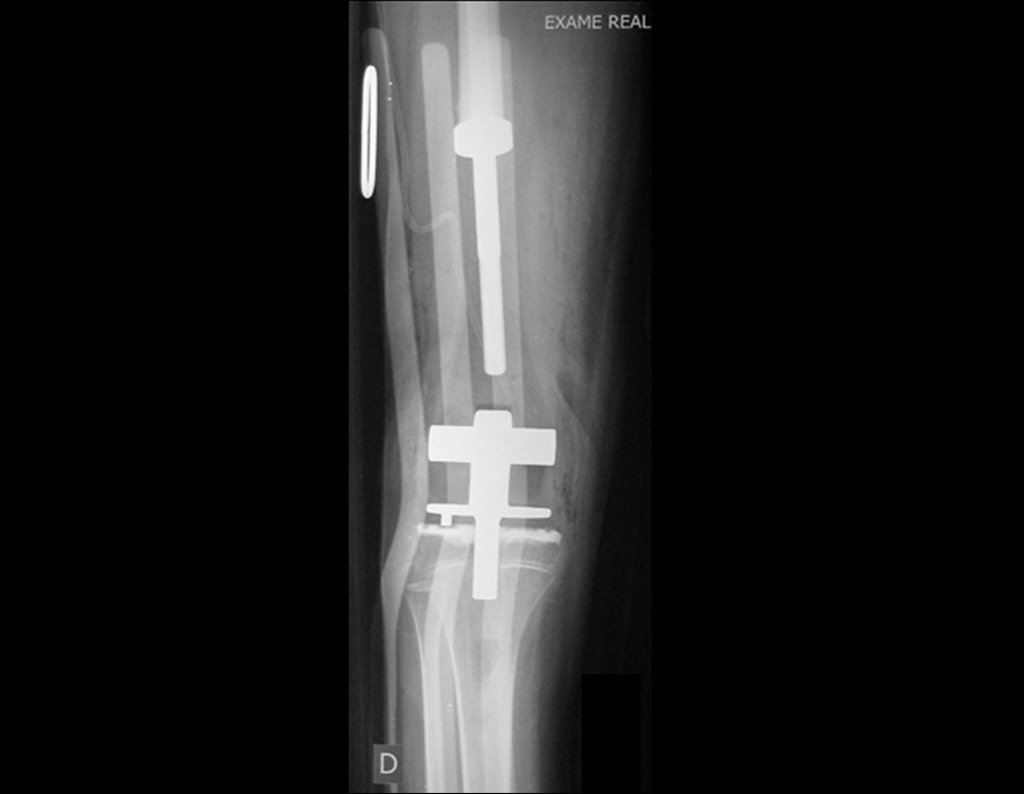
Figura 99: Radiografia frente no pós-operatório imediato, bom posicionamento dos componentes.
Figure 99: Front radiograph in the immediate postoperative period, good positioning of the components.
Figura 100: Radiografia perfil no pós-operatório imediato.
Figure 100: Lateral radiograph in the immediate postoperative period.
Figura 101: Paciente andando com carga parcial no segundo dia após a cirurgia.
Figure 101: Patient walking with partial load on the second day after surgery.
Figura 102: Áreas de necrose pós quimioterapia, 45% de necrose - Huvos I.
Figure 102: Areas of post-chemotherapy necrosis, 45% necrosis - Huvos I.
Figura 103: Efeito fibrovascular. Células neoplásicas viáveis.
Figure 103: Fibrovascular effect. Viable neoplastic cells.
Figura 104: Laudo da anatomia patológica.
Figure 104: Pathological anatomy report.
Figura 105: RM axial -t1-inf unil_2015-03-31.
Figure 105: Axial MRI -t1-inf unil_2015-03-31.
Figura 106: RM axial -t1-inf unil-2_2015-03-31.
Figure 106: Axial MRI -t1-inf unil-2_2015-03-31.
Figura 107: RM axial -t1-inf unil-3_2015-03-31.
Figure 107: Axial MRI -t1-inf unil-3_2015-03-31.
Figura 108: RM axial-t1-inf unil-4_2015-03-31.
Figure 108: MRI axial-t1-inf unil-4_2015-03-31.
Figura 109: RM cor-t1_2015-03-31.
Figure 109: RM cor-t1_2015-03-31.
Figura 110: 9923 - RM cor-t1-pos_2015-03-31.
Figure 110: 9923 - RM cor-t1-pos_2015-03-31.
Figura 111: 9924 - RM cor-stir_2015-03-31.
Figure 111: 9924 - RM cor-stir_2015-03-31.
Figura 112: Sub-s16-s3-1_2015-03-31.
Figure 112: Sub-s16-s3-1_2015-03-31.
Figura 113: Sub-s17-s8-1_2015-03-31.
Figure 113: Sub-s17-s8-1_2015-03-31.
Figura 114: Laudo da ressonância magnética, pós operatória, de 31/03/2015
Figure 114: Magnetic resonance imaging report, post-operative, dated 03/31/2015
Figura 115: Pós-operatório de onze meses, membros alinhados e simétricos, em 20/04/2015.
Figure 115: Eleven months post-operative, limbs aligned and symmetrical, on 04/20/2015.
Figura 116: Bom aspecto da ferida operatória, após 11 meses da cirurgia.
Figure 116: Good appearance of the surgical wound, 11 months after surgery.
Figura 117: Carga total, monopodal após onze meses da cirurgia. Bom alinhamento, sem deformidade.
Figure 117: Full weight, single leg, eleven months after surgery. Good alignment, no deformity.
Figura 114: Laudo da ressonância magnética, pós-operatória, de 31/03/2015.
Figure 114: Post-operative MRI report, dated 03/31/2015.
Figura 119: Flexão de 90 graus em situação de repouso.
Figure 119: 90-degree flexion at rest.
Figura 120: Extensão ativa normal, 180 graus.
Figure 120: Normal active extension, 180 degrees.
Figura 121: Cicatriz operatória acompanhando o trajeto anatômico do vasto medial. Boa cicatrização.
Figure 121: Operative scar following the anatomical path of the vastus medialis. Good healing.
Video 3: Patient undergoing postoperative chemotherapy and physiotherapy, good extension and good flexion of the knee.
Video 4: Patient undergoing chemotherapy and physiotherapy eleven months after surgery. Active flexion function, with load, of approximately 45 degrees.
Figura 122: Ressonância de 22/04/2015, onze meses após a cirurgia, em incidência coronal T1 documentando a endoprótese, com imprecisão pelos artefatos da imagem.
Figure 122: MRI on 04/22/2015, eleven months after surgery, in coronal T1 view documenting the endoprosthesis, with imprecision due to image artifacts.
Figura 123: Ressonância coronal T1, de onze meses após a cirurgia, documentando a endoprótese.
Figure 123: Coronal T1 resonance, eleven months after surgery, documenting the endoprosthesis.
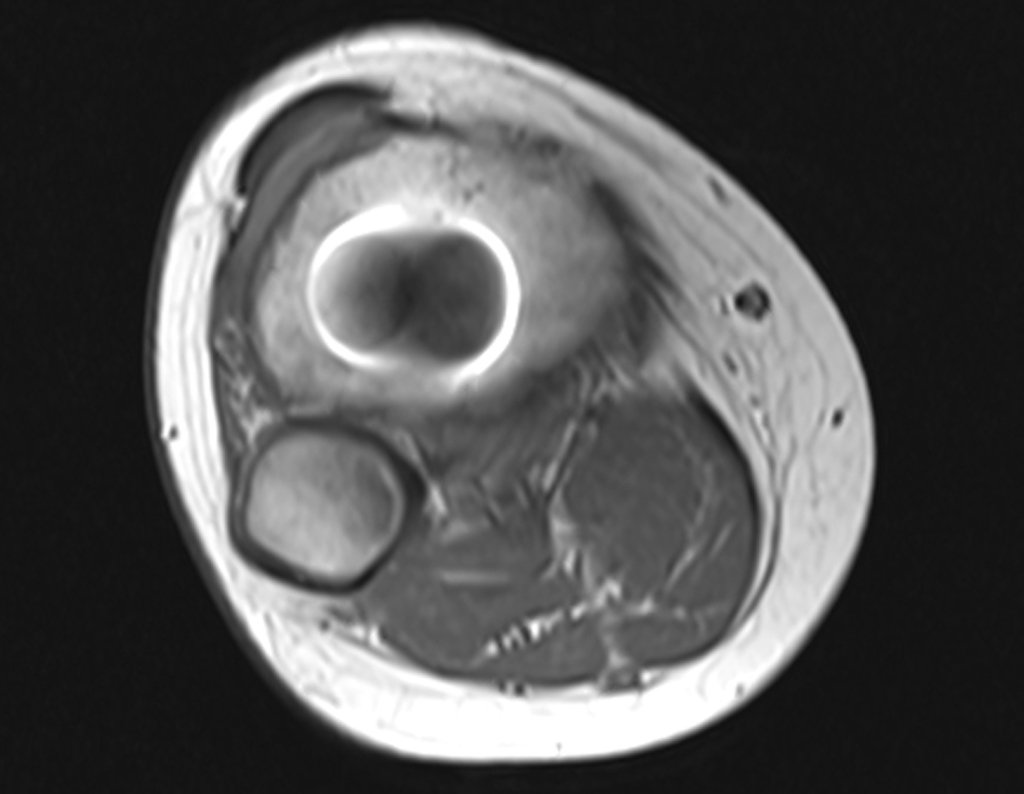
Figura 124: RM axial T1 com imagem de baixo sinal dentro do canal medular, que corresponde à haste femoral da prótese.
Figure 124: Axial T1 MRI with low signal image inside the spinal canal, which corresponds to the femoral stem of the prosthesis.
Figura 125: RM ax T1 fat, a imagem de baixo sinal na medular óssea corresponde a haste da prótese, circundada por halo de alto sinal que corresponde ao cimento ósseo.
Figure 125: MRI ax T1 fat, the low signal image in the bone marrow corresponds to the prosthesis stem, surrounded by a high signal halo that corresponds to the bone cement.
Figura 126: RM ax T1, corte mais inferior, com baixo sinal na projeção da medular óssea, correspondendo ao prolongador da endoprótese, composto por polietileno e titâneo.
Figure 126: MRI ax T1, lower section, with low signal in the projection of the bone marrow, corresponding to the endoprosthesis extender, composed of polyethylene and titanium.
Figura 127: RM ax T1 fat, com contraste, boa fixação da haste femoral.
Figure 127: MRI ax T1 fat, with contrast, good fixation of the femoral stem.
Figura 128: RM ax T1, corte mais inferior, com área de baixo sinal que corresponde ao corpo da endoprótese, composto por polietileno e titâneo.
Figure 128: MRI ax T1, lower section, with low signal area that corresponds to the body of the endoprosthesis, composed of polyethylene and titanium.
Figura 129: Laudo da ressonância magnética de controle, em 22/04/2015.
Figure 129: Control MRI report, on 04/22/2015.
Figura 130: Radiografia de 17/06/2015, após um ano e um mês da cirurgia, seta branca aponta a posição atual da fise de crescimento, seta vermelha aponta a cicatriz da posição anterior da placa de crescimento.
Figure 130: Radiograph from 06/17/2015, one year and one month after surgery, white arrow points to the current position of the growth plate, red arrow points to the scar in the previous position of the growth plate.
Figura 131: Radiografias em perfil, evidenciando o correto posicionamento da prótese.
Figure 131: Profile radiographs, showing the correct positioning of the prosthesis.
Figura 132: Laudo das radiografias do fêmur, em 17/06/2015.
Figure 132: Report of femur x-rays, on 06/17/2015.
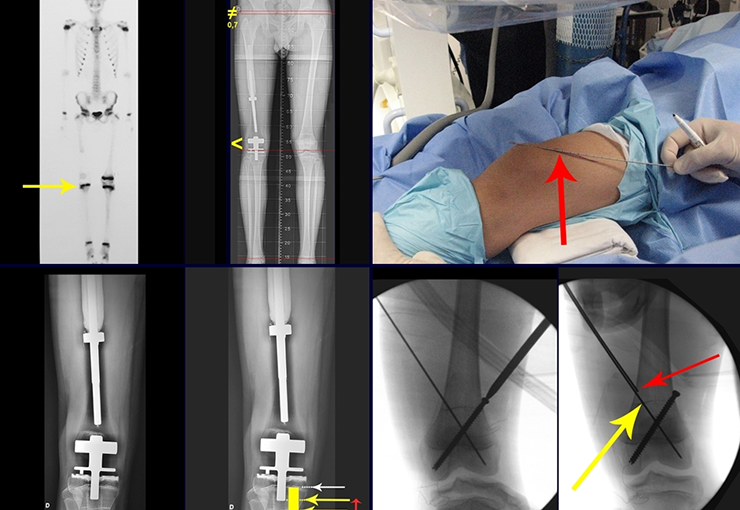
Note that there has already been growth of the tibia. The red arrow points to the scar where the growth plate was. The white arrow points to the current position of the growth plate. The yellow bar marks how much this bone segment has grown, figure 130.
Figura 133: RM axial T1-sup_2015-08-19.
Figure 133: RM axial T1-sup_2015-08-19.
Figura 134: RM axial t1 inf_2015-08-19.
Figure 134: RM axial t1 inf_2015-08-19.
Figura 135: RM axial - stir-sup_2015-08-19.
Figure 135: RM axial - stir-sup_2015-08-19.
Figura 136: RM axil - stir - inf_2015-08-19.
Figure 136: RM axil - stir - inf_2015-08-19.
Figura 137: RM cor T1 - semac pre_2015-08-19.
Figure 137: RM cor T1 - semac pre_2015-08-19.
Figura 138: RM cor - dp - vat_2015-08-19.
Figure 138: RM cor - dp - vat_2015-08-19.
Figura 139: RM cor - T1 - semac_2015-08-19.
Figure 139: RM cor - T1 - semac_2015-08-19.
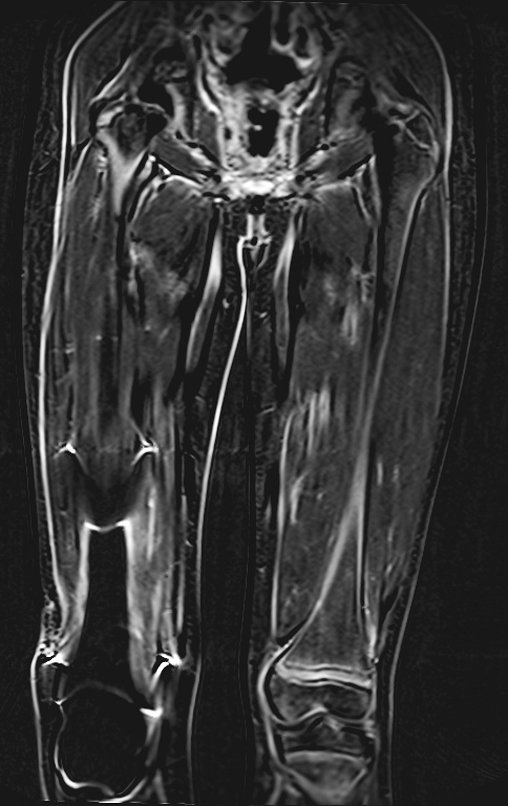
Figura 140: RM cor - stir - semac_2015-08-19.
Figure 140: RM cor - stir - semac_2015-08-19.
Figura 140: 2015-08-19_RM axial T1 sup unil.
Figure 140: 2015-08-19_RM axial T1 sup unil.
Figura 141: 2015-08-19_RM axial T1 sup unil-2.
Figure 141: 2015-08-19_RM axial T1 sup unil-2.
Figura 141: 2015-08-19_RM axial T1 sup unil-2.
Figure 142: 2015-08-19_RM axial T1 sup unil- 2a.
Figura 143: RM axial T1 sup unil-3.
Figure 143: RM axial T1 sup unil-3.
Figura 144: RM axial T2 fat-unil.
Figure 144: RM axial T2 fat-unil.
Figura 145: 2015-08-19_ RM axial T2 fat-unil-2.
Figure 145: 2015-08-19_ RM axial T2 fat-unil-2.
Figura 146: 2015-08-19_RM cor T1.
Figure 146: 2015-08-19_RM cor T1.
Figura 147: 2015-08-19_RM cor-stir.
Figure 147: 2015-08-19_RM cor-stir.
Figura 148: 2015-08-19_RM cor-T2-dixon.
Figure 148: 2015-08-19_RM cor-T2-dixon.
Figura 149: 2015-08-19_RM cor-vol-pos-dixon.
Figure 149: 2015-08-19_RM cor-vol-pos-dixon.
Figura 150: Laudo da ressonância de controle de 19/08/2015.
Figure 150: Control resonance report of 08/19/2015.
Figura 151: Paciente já fora de quimioterapia, aspecto clínico em 29/09/2015, após um ano e quatro meses da cirurgia.
Figure 151: Patient no longer undergoing chemotherapy, clinical appearance on 09/29/2015, one year and four months after surgery.
Figura 152: Aspecto no perfil, após um ano e quatro meses.
Figure 152: Profile appearance, after one year and four months.
Figura 153: Carga total monopodal, com bom alinhamento, após 16 meses da cirurgia.
Figure 153: Total single-leg weight bearing, with good alignment, 16 months after surgery.
Figura 154: Flexão dos joelhos ativa, com carga, de 90 graus. Boa função e simetria dos membros inferiores.
Figure 154: Active knee flexion, with load, 90 degrees. Good function and symmetry of the lower limbs.
Video 5: Active extension of 180 degrees and flexion of 90 degrees, on 09/29/2015, sixteen months after surgery.
Video 6: Walking and 90-degree flexion function, active and with load, sixteen months after the operation.
Video 7: Good balance and good function for activities of daily living.
Figura 155: Radiografia frente em 10/10/2015, após dezessete meses de operado. Seta branca aponta a fise de crescimento, seta vermelha a linha da cicatriz da antiga posição da fise de crescimento. Barra em amarelo assinala o quanto cresceu esta parte da tíbia.
Figure 155: Front X-ray on 10/10/2015, after seventeen months of surgery. White arrow points to the growth physis, red arrow the scar line from the old position of the growth physis. Yellow bar indicates how much this part of the tibia has grown.
Figura 156: Radiografia de perfil, após dezessete meses, em 10/10/2015.
Figure 156: Profile x-ray, after seventeen months, on 10/10/2015.
Figura 157: Radiografia em maior aumento, de 10/10/2015, destacando o crescimento da linha epifisial da região proximal da tíbia.
Figure 157: Radiograph at higher magnification, from 10/10/2015, highlighting the growth of the epiphyseal line in the proximal region of the tibia.
Figura 158: Radiografia de perfil, em maior aumento, de 10/10/2015, destacando o crescimento da cartilagem epifisial da região proximal da tíbia.
Figure 158: Profile x-ray, at higher magnification, from 10/10/2015, highlighting the growth of the epiphyseal cartilage in the proximal region of the tibia.

The path of the nail crossing the epiphyseal line is correct and is in accordance with the technique used. The presence of the nail may cause concern regarding the possibility of interference with the growth of the physis, as it is a little known technique, but this does not occur.

Careful passage of this 1.0 cm diameter rod, protected by a non-cemented polyethylene “shirt”, does not block the growth cartilage.

It can be seen that the proximal physis of the tibia continues its growth, without blockage, despite having received at its central point the passage of the rotating tibial component, protected by the polyethylene shirt, figure 155.

This growth is evident, especially if we compare it with figure 130, from 06/16/2015, four months earlier.

The red arrow points to the scar where the growth plate was. The white arrow points to the current position of the growth plate. The yellow bar marks how much this bone segment has grown. On this occasion we recommend epiphysiodesis to control the discrepancy.

Figura 159: Laudo da radiografia de 10/10/2015, referindo trajeto de haste na tíbia proximal.
Figure 159: X-ray report from 10/10/2015, referring to the path of the nail in the proximal tibia.
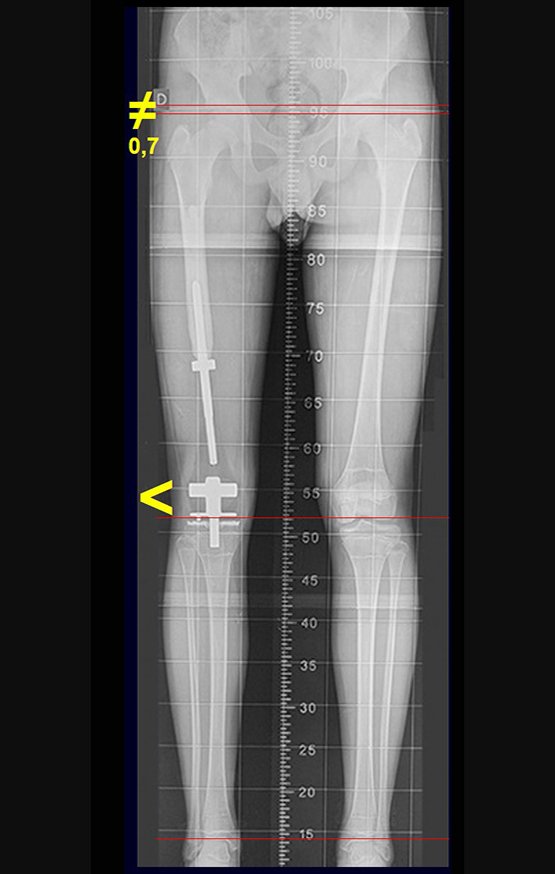
Figura 160: Laudo do escanograma de outubro de 2016. Discrepância de 0,7 cm.
Figure 160: Scanogram report from October 2016. Discrepancy of 0.7 cm.
Figura 161: No Pet-Ct podemos observar a falta da linha da fise do fêmur direito, substituída pela prótese. A cartilagem de crescimento da tíbia direita está presente.
Figure 161: In Pet-Ct we can see the lack of the physis line of the right femur, replaced by the prosthesis. Growth cartilage of the right tibia is present.
Figura 162: Cintilografia óssea revelando a viabilidade da linha epifisial da tíbia do lado operado, apesar da existência da haste tibial.
Figure 162: Bone scintigraphy revealing the viability of the epiphyseal line of the tibia on the operated side, despite the existence of the tibial nail.
Figura 163: Em destaque, a cintilografia mostra que a fise da tíbia do lado operado encontra-se viável, seta amarela.
Figure 163: Highlighted, the scintigraphy shows that the tibial physis on the operated side is viable, yellow arrow.
Figura 164: Escanograma mostrando o crescimento da tíbia do lado operado, cartilagem de crescimento da tíbia viável.
Figure 164: Scanogram showing tibial growth on the operated side, viable tibial growth cartilage.
Video 8: Function in December 2016, two years after surgery. Gait without lameness, good flexion function with load.
Five months passed between the indication of epiophysiodesis and its completion. During this period, the patient presented a significant growth spurt, increasing the discrepancy of the lower limbs, now reaching 1.5 cm. Scanogram from January 2017, figure 165.
Figura 165: Radiografia de janeiro de 2017. Aumento significativo do crescimento!
Figure 165: Radiograph from January 2017. Significant increase in growth!
Figura 166: As sinalizações na radiografia mostram o crescimento da placa fisária da tíbia. Seta branca assinala a cartilagem de crescimento, seta vermelha o pico de crescimento.
Figure 166: The signs on the radiograph show the growth of the tibial physeal plate. White arrow marks the growth cartilage, red arrow the growth peak.
Figura 167: Radiografia com inclinação da bacia e atitude escoliótica, consequente ao encurtamento.
Figure 167: Radiograph showing pelvic tilt and scoliotic attitude, resulting from shortening.
Figura 168: Escanograma de janeiro de 2017, discrepância de 1,5 cm.
Figure 168: Scanogram from January 2017, discrepancy of 1.5 cm.
Figura 169: Comparação entre as medidas do escanograma de 09 de setembro de 2016 e 21 de janeiro de 2017. Aumento da discrepância de 0,7 para 1,5 cm, em cinco meses.
Figure 169: Comparison between scanogram measurements from September 9, 2016 and January 21, 2017. Increase in discrepancy from 0.7 to 1.5 cm, in five months.
Video 9: Balance and function, in January 2017, three years after surgery.
Video 10: Evident lower limb discrepancy.
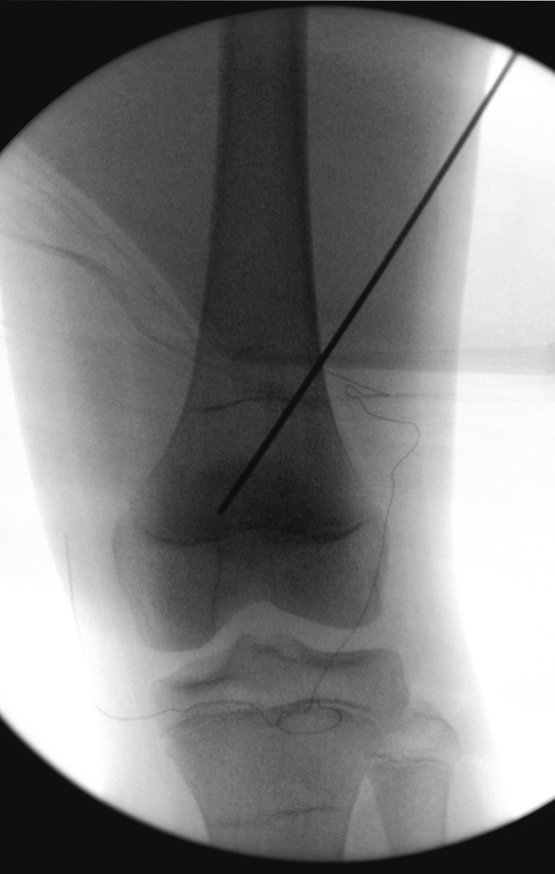
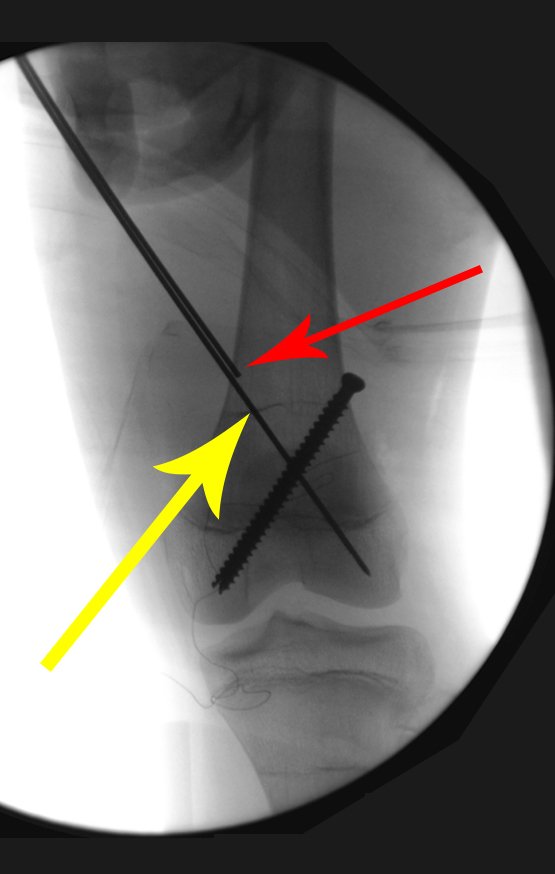
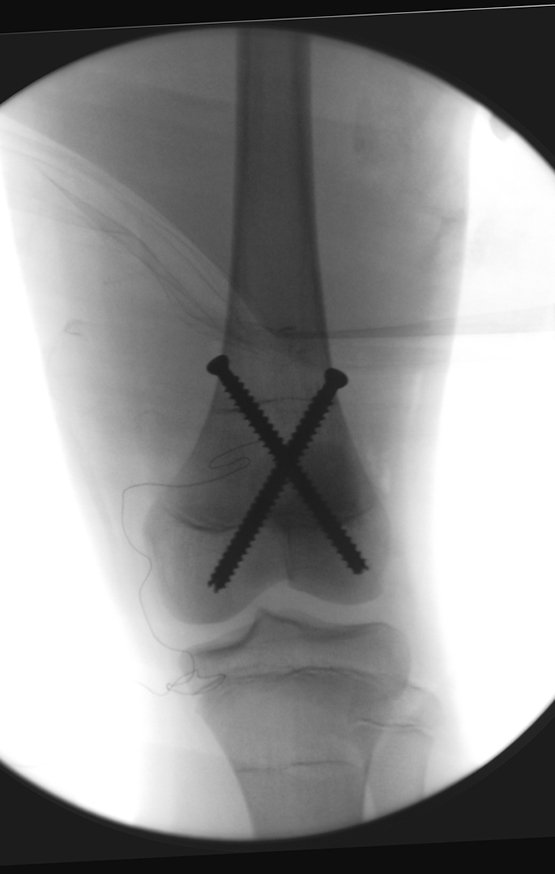
We programmed epiphysiodesis to definitively block only the growth of the distal growth cartilage of the contralateral femur. This procedure is performed with the patient anesthetized, under radioscopy control, as described in the figures below.
Figura 170: A seta vermelha aponta o fio guia sobre a pele e visualização da orientação na radioscopia.
Figure 170: The red arrow points the guide wire over the skin and visualization of the orientation on radioscopy.
Figura 171: Visualização e ajuste na radioscopia.
Figure 171: Visualization and adjustment in radioscopy.
Figura 172: Com uma caneta própria assinalamos a direção na pele, seta amarela.
Figure 172: Using a pen, we mark the direction on the skin, yellow arrow.
Figura 173: Introdução do fio guia até tocar a cortical lateral e conferência da orientação na radioscopia.
Figure 173: Introduction of the guide wire until it touches the lateral cortex and checking the orientation on radioscopy.
Figura 174: Novo controle após a perfuração da cortical lateral e a penetração do fio guia, em direção ao côndilo medial.
Figure 174: New control after perforation of the lateral cortex and penetration of the guide wire, towards the medial condyle.
Figura 175: Aprofundamento do fio guia até o ponto final, no côndilo femoral.
Figure 175: Deepening the guide wire to the end point, at the femoral condyle.
Figura 176: Perfuração com a broca.
Figure 176: Drilling with the drill.
Figura 177: Colocação do parafuso canulado de rosca total, orientado pelo fio guia.
Figure 177: Placement of the full-thread cannulated screw, guided by the guide wire.
Figura 178: Realização da medida do parafuso lateral. A seta amarela aponta o fio guia e a seta vermelha aponta o medidor.
Figure 178: Taking the lateral screw measurement. The yellow arrow points to the guide wire and the red arrow points to the meter.
The same procedure is repeated for the wire from medial to lateral, taking care to check the parallelism between them, leaving space so that they do not collide at the intersection. Next, drilling of the cortex begins with the calibrated drill for the passage of the full-thread cannulated screw
Figura 179: Perfuração com broca, para o parafuso medial. Seta azul, broca canulada. Seta amarela, controle da extremidade da perfuração, que deve ultrapassar a fise de crescimento. Seta vermelha aponta o fio guia
Figure 179: Drilling with a drill for the medial screw. Blue arrow, cannulated drill. Yellow arrow, control the end of the perforation, which must exceed the growth physis. Red arrow points to the guide wire
Figura 180: Colocação do parafuso medial, através do fio guia.
Figure 180: Placement of the medial screw, through the guide wire.
Figura 181: Retirada do fio guia e aperto final.
Figure 181: Removing the guide wire and final tightening.
Figura 182: Controle do posicionamento, frente. Parafusos justa cortical, para não incomodar o paciente, sem atingir a cartilagem articular.
Figure 182: Positioning control, front. Cortical tight screws, so as not to disturb the patient, without reaching the articular cartilage.
Figura 183: Controle na radioscopia do paralelismo no perfil.
Figure 183: Radioscopic control of parallelism in the profile.
Figura 184: Conferência do comprimento, que não atinge a cartilagem articular.
Figure 184: Checking the length, which does not reach the articular cartilage.
Figura 185: Conferência do comprimento em rotação interna e externa, certificando-se que não compromete a cartilagem articular.
Figure 185: Checking the length in internal and external rotation, making sure that it does not compromise the articular cartilage.
Figura 186: Curativo final e enfaixamento.
Figure 186: Final dressing and bandaging.

Author: Prof. Dr. Pedro Péricles Ribeiro Baptista

 Orthopedic Oncosurgery at the Dr. Arnaldo Vieira de Carvalho Cancer Institute

Leave a Reply

Hello! How can we assist you?